


 20 / 127

15
National Dairy Development Board
Dairying in ODISHA
-
A Statistical Profile
2016
Part I :
General Statistics
I.3. State Economy
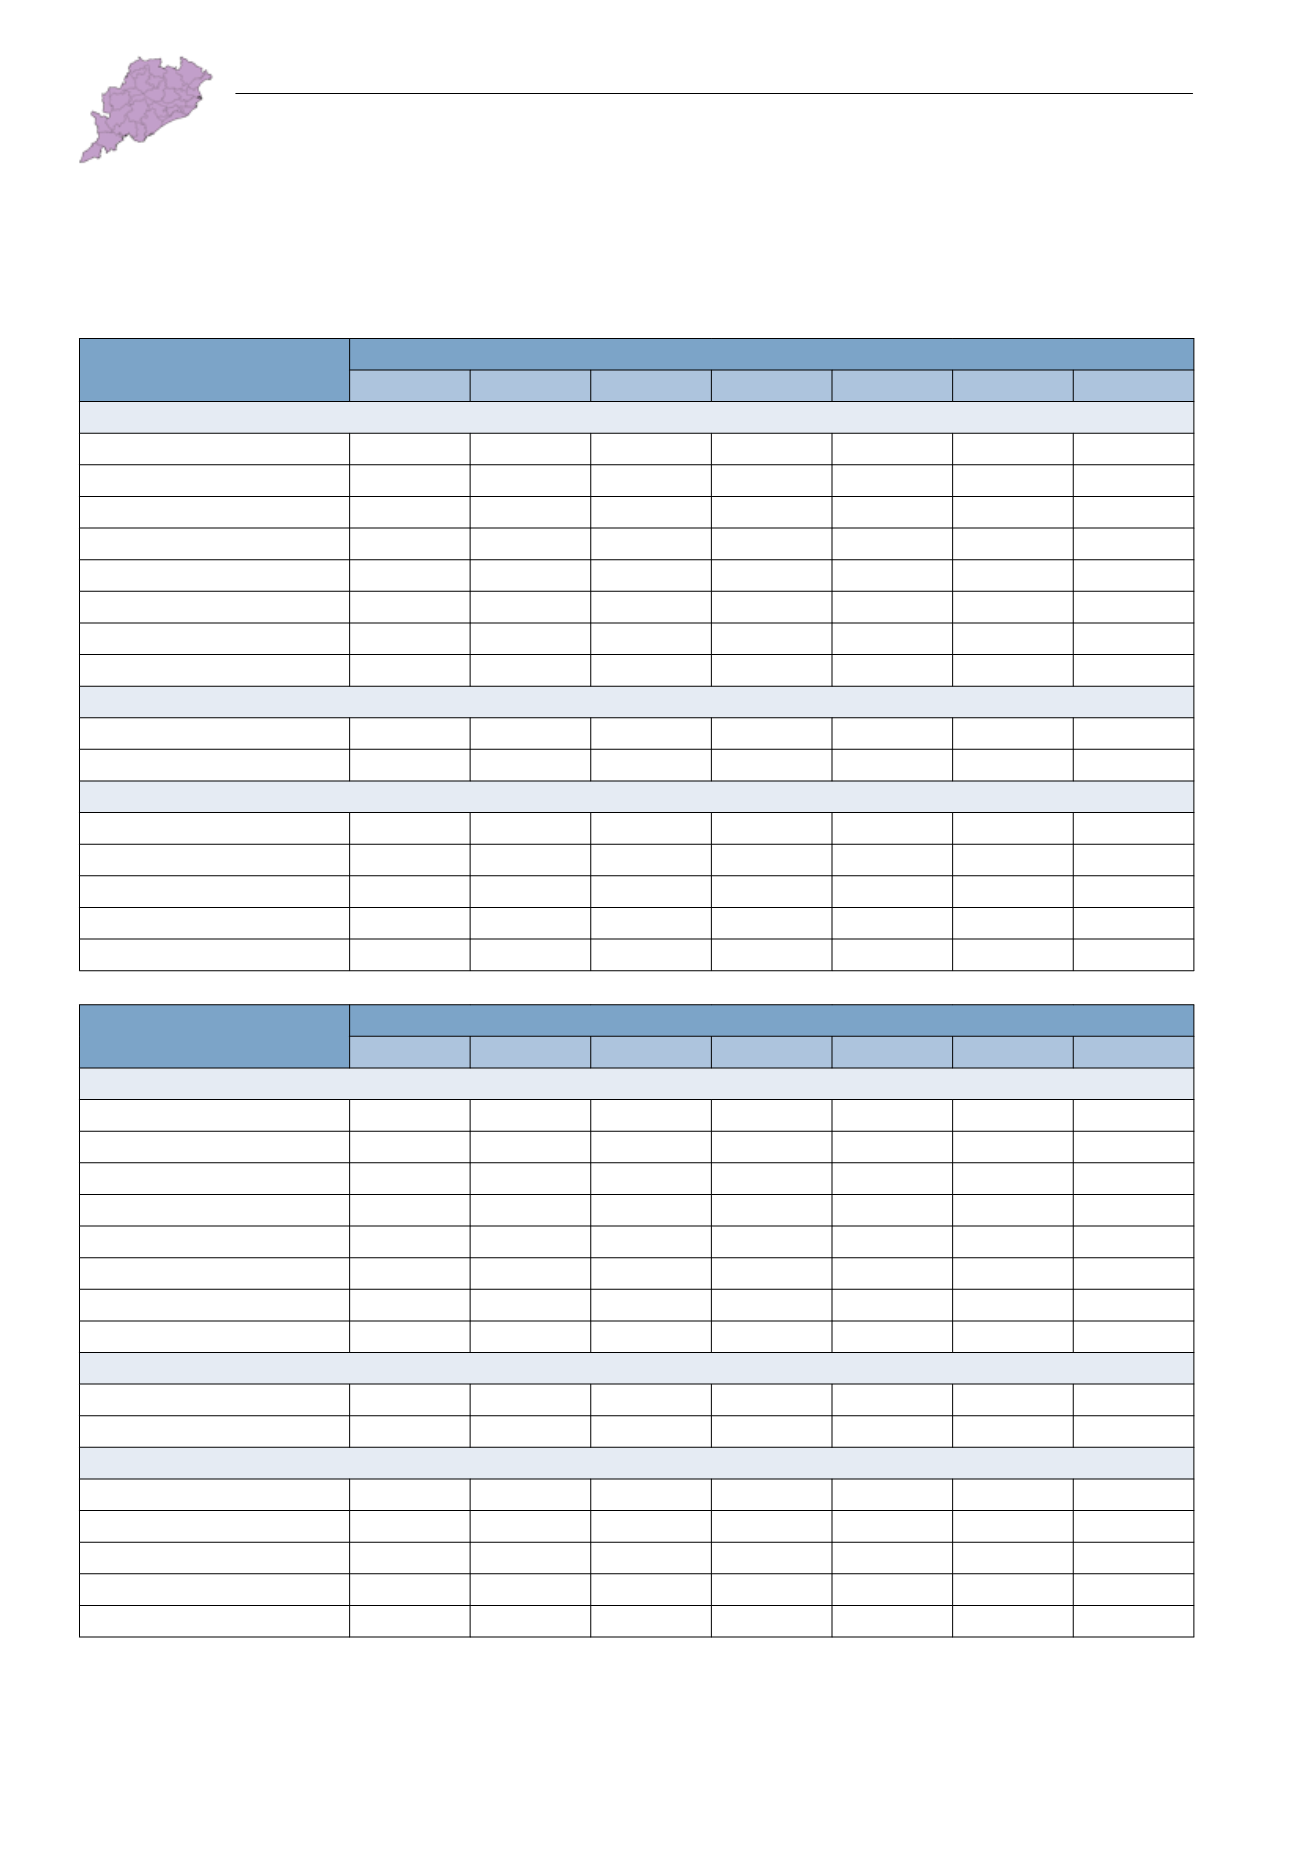
TABLE I.3.2: Value of Output: Agriculture and Livestock
Item
At Current Prices
2004-05 2005-06 2006-07 2007-08 2008-09 2009-10 2010-11
Value of Output (
`
billion)
Agriculture & Allied
235
245
279
383
397
436
482
Agriculture
159
170
190
278
274
291
311
Livestock
32
32
41
49
65
80
90
Milk
16
17
19
22
25
29
32
Meat
13
12
16
19
25
35
40
Egg
2
2
2
3
5
6
7
Dung
3
3
5
5
11
12
13
Others^
-2
-2
-2
-1
-1
-1
-2
Share of Value of Output to Agriculture and Allied (%)
Agriculture
67.7
69.4
68.1
72.6
69.0
66.7
64.5
Livestock
13.6
13.1
14.7
12.8
16.4
18.3
18.7
Share of Value of Output to Livestock Output (%)
Milk
50.9
52.3
46.1
45.6
39.1
36.1
35.5
Meat
40.5
37.8
39.9
39.4
39.1
43.7
44.7
Egg
5.9
6.1
6.1
6.4
7.2
7.6
7.5
Dung
9.4
9.7
11.6
10.1
16.9
14.4
14.1
Others^
-6.7
-5.9
-3.8
-1.5
-2.3
-1.8
-1.8
Item
At Constant Prices (2004-05)
2004-05 2005-06 2006-07 2007-08 2008-09 2009-10 2010-11
Value of Output (
`
billion)
Agriculture & Allied
235
242
248
260
257
289
297
Agriculture
159
164
165
171
173
188
193
Livestock
32
33
37
42
49
52
54
Milk
16
17
18
20
20
21
21
Meat
13
13
14
15
18
20
21
Egg
2
2
2
2
3
4
4
Dung
3
3
4
4
9
9
10
Others^
-2
-2
-2
-1
-2
-1
-1
Share of Value of Output to Agriculture and Allied (%)
Agriculture
67.7
67.8
66.5
65.8
67.3
65.1
65.0
Livestock
13.6
13.6
14.9
16.2
19.1
18.0
18.2
Share of Value of Output to Livestock Output (%)
Milk
50.9
50.4
48.1
48.9
41.2
39.5
38.5
Meat
40.5
39.9
38.5
37.0
36.6
38.4
38.2
Egg
5.9
6.0
5.9
5.9
6.4
6.9
6.7
Dung
9.4
9.0
11.5
10.3
19.1
17.8
18.8
Others^
-6.7
-5.3
-4.1
-2.0
-3.2
-2.6
-2.2
^ Includes Wool and Hair, Silkworm Cocoons & Honey, Increment in Stock.
Source: State wise estimates of value of output from agriculture and allied activities with new base year 2004-2005 (Published in 2013), Ministry of Statistics
and Programme Implementation, Govt. of India.