
61
National Dairy Development Board
Part IV :
Milk Production
Dairying in ODISHA
-
A Statistical Profile
2016
IV.3. Production Performance: Milk Production
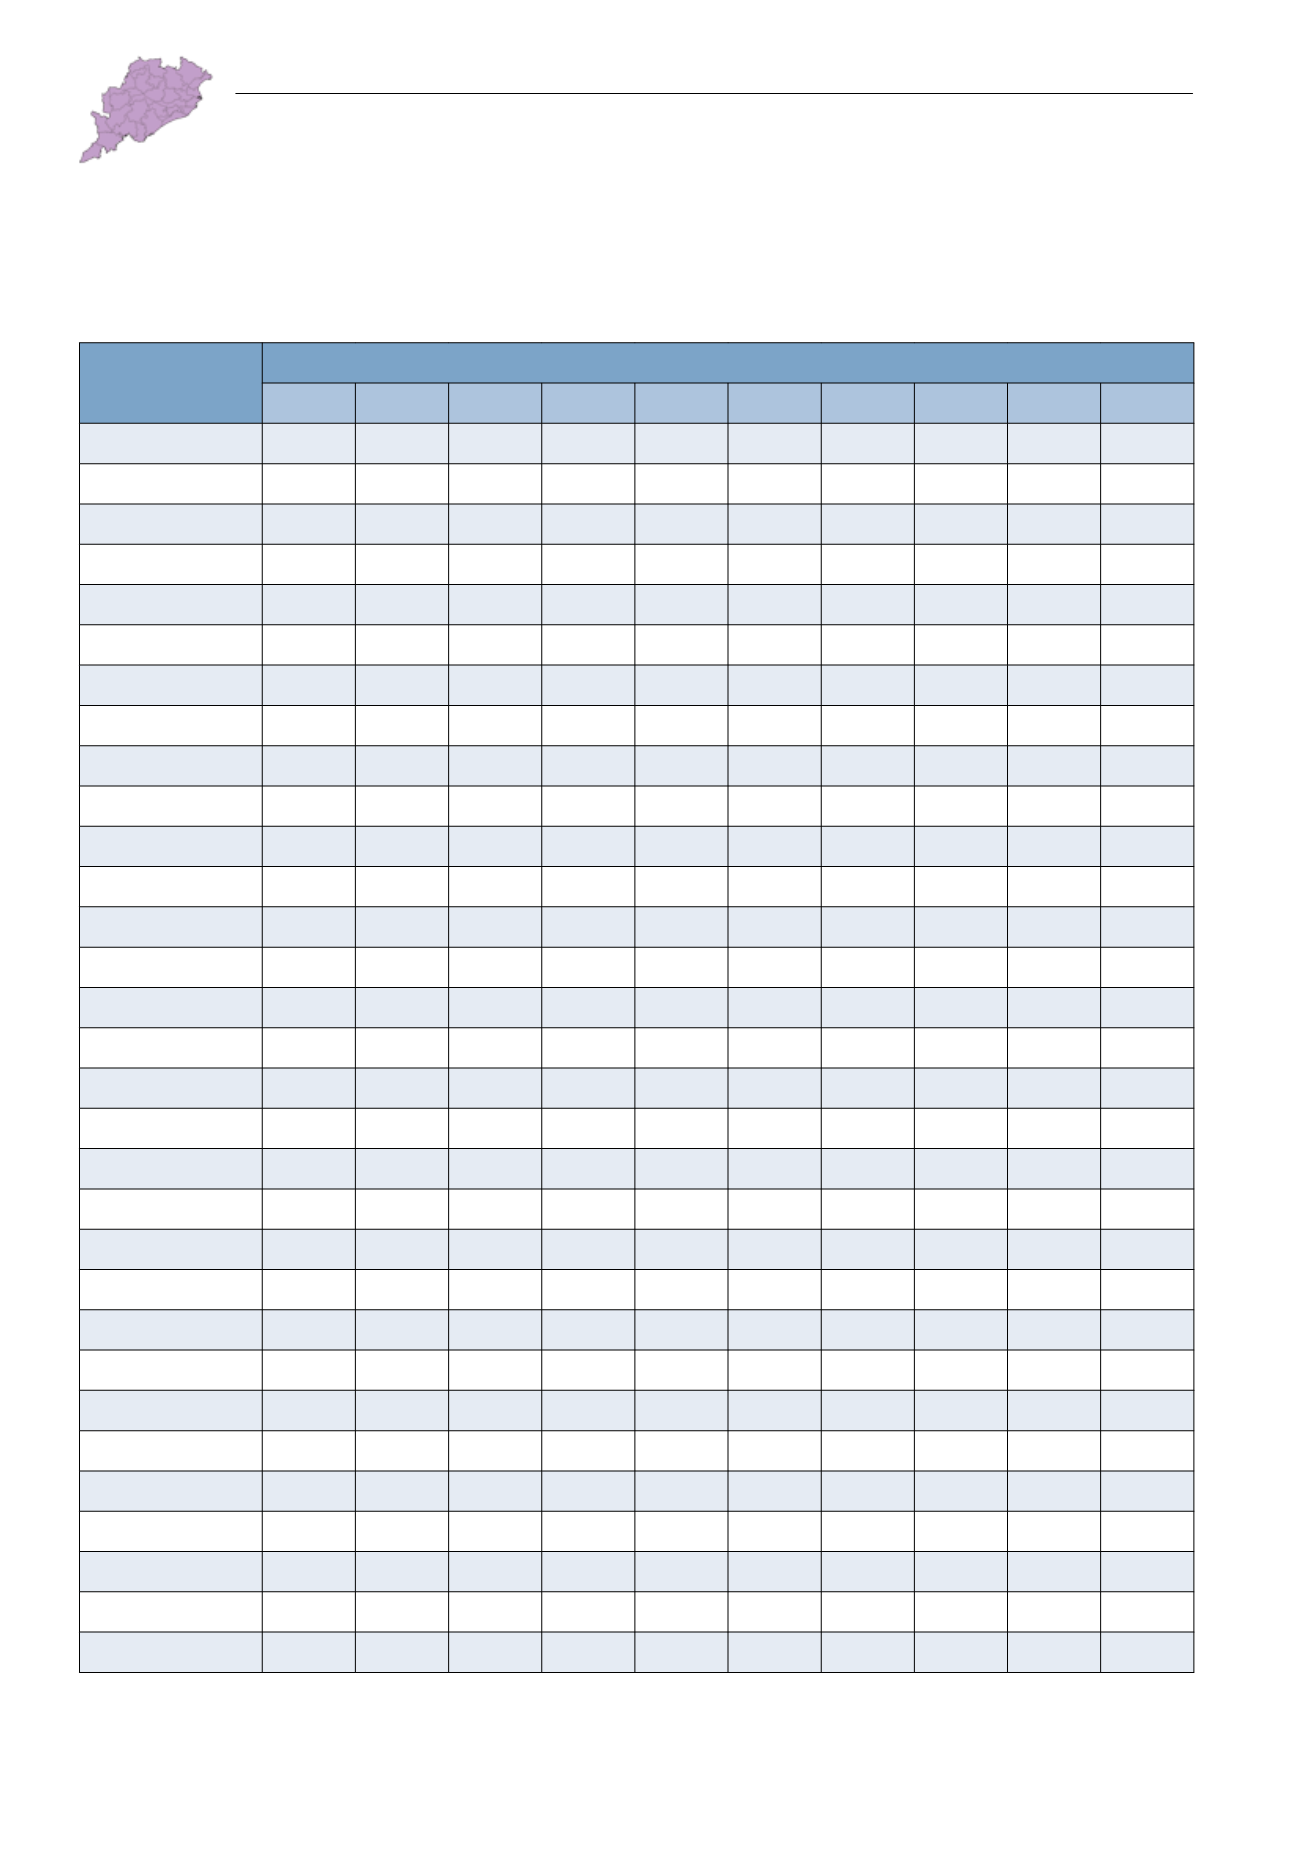
TABLE IV.3.1: Year and District-wise Bovine Milk Production
Districts
Bovine Milk Production
(‘000 MT)
1992-93 1997-98 2003-04 2006-07 2008-09 2009-10 2010-11 2011-12 2012-13 2013-14
ODISHA
539.6 669.2 992.3 1,428.2 1,595.7 1,648.5 1,667.0 1,715.0 1,781.0 1,858.3
Anugul
22.1 34.9
41.3 41.9 43.4 44.6 41.6 47.3 49.3
Balangir
33.0 22.3 33.9
53.2 62.5 64.4 71.3 45.6 39.1 40.9
Baleshwar
42.9 23.7 33.6
65.1 118.6 120.8 111.6 124.3 133.4 138.9
Bargarh
34.5 52.7
55.8 50.1 52.8 78.9 85.1 77.0 80.5
Baudh
6.0 11.3
27.4 21.0 21.6 15.2 21.6 22.4 23.4
Bhadrak
16.8 24.3
45.2 64.0 65.4 34.1 36.8 67.1 70.1
Cuttack
111.2 62.6 101.7
165.8 142.8 149.2 156.4 150.5 149.8 155.7
Debagarh
4.7
5.1
7.0 12.0 11.4 11.3
9.1 24.4 25.5
Dhenkanal
39.7 24.9 33.4
34.7 52.0 53.1 53.7 55.1 56.4 58.8
Gajapati
8.4 12.0
13.0 20.8 21.5 22.3 26.1 31.7 33.1
Ganjam
45.8 50.3 78.7
101.7 85.9 87.6 98.2 102.9 103.6 108.5
Jagatsinghapur
49.3 66.4
89.3 88.8 93.6 92.7 102.1 101.5 105.3
Jajapur
21.5 24.5
78.9 74.4 76.1 64.9 99.9 105.6 110.0
Jharsuguda
5.9
7.9
12.5 16.9 17.6 11.0 13.8 12.2 12.8
Kalahandi
22.2 19.2 28.8
27.9 42.0 43.0 47.2 51.5 50.8 53.2
Kandhamal
10.5
9.4 14.6
15.6 20.3 20.7 13.0 14.6 15.6 16.4
Kendrapara
22.4 31.2
56.3 53.6 55.3 95.1 65.5 65.2 67.9
Kendujhar
16.5 21.3 33.1
71.3 69.0 71.9 47.8 52.8 43.7 45.4
Khordha
43.4 63.7
56.0 56.2 58.4 42.4 53.0 68.4 71.6
Koraput
44.4 18.0 32.1
44.4 55.4 56.9 154.5 125.8 94.0 98.3
Malkangiri
7.7 10.9
14.6 31.5 32.1 39.4 41.4 51.1 53.8
Mayurbhanj
14.6 23.7 29.8
66.2 80.3 83.3 69.4 68.2 69.1 71.8
Nabarangapur
8.8 15.5
19.4 21.9 22.4 15.3 23.1 17.6 18.4
Nayagarh
11.9 16.0
17.4 20.0 20.4 20.7 24.4 24.8 25.7
Nuapada
7.7
9.0
11.1 25.4 25.9 15.2 16.0 27.6 28.8
Puri
96.6 59.0 83.5
91.1 102.8 107.7 99.8 108.0 126.5 132.0
Rayagada
17.9 28.1
33.4 33.8 34.6 30.9 36.8 41.8 43.9
Sambalpur
43.2 15.7 31.5
30.3 39.7 41.2 37.7 35.9 32.9 34.2
Subarnapur
5.6 12.5
25.5 52.5 54.4 31.9 41.4 39.1 40.8
Sundargarh
18.9 24.3 32.2
56.8 40.5 41.9 40.4 42.8 41.8 43.5
Source: Integrated Sample Survey Reports (1992-93 to 2013-14), Directorate of Animal Husbandry and Veterinary Services, Govt. of Odisha.


