


 90 / 127

85
National Dairy Development Board
Part V :
Veterinary Infrastructure And
Service Delivery System
Dairying in ODISHA
-
A Statistical Profile
2016
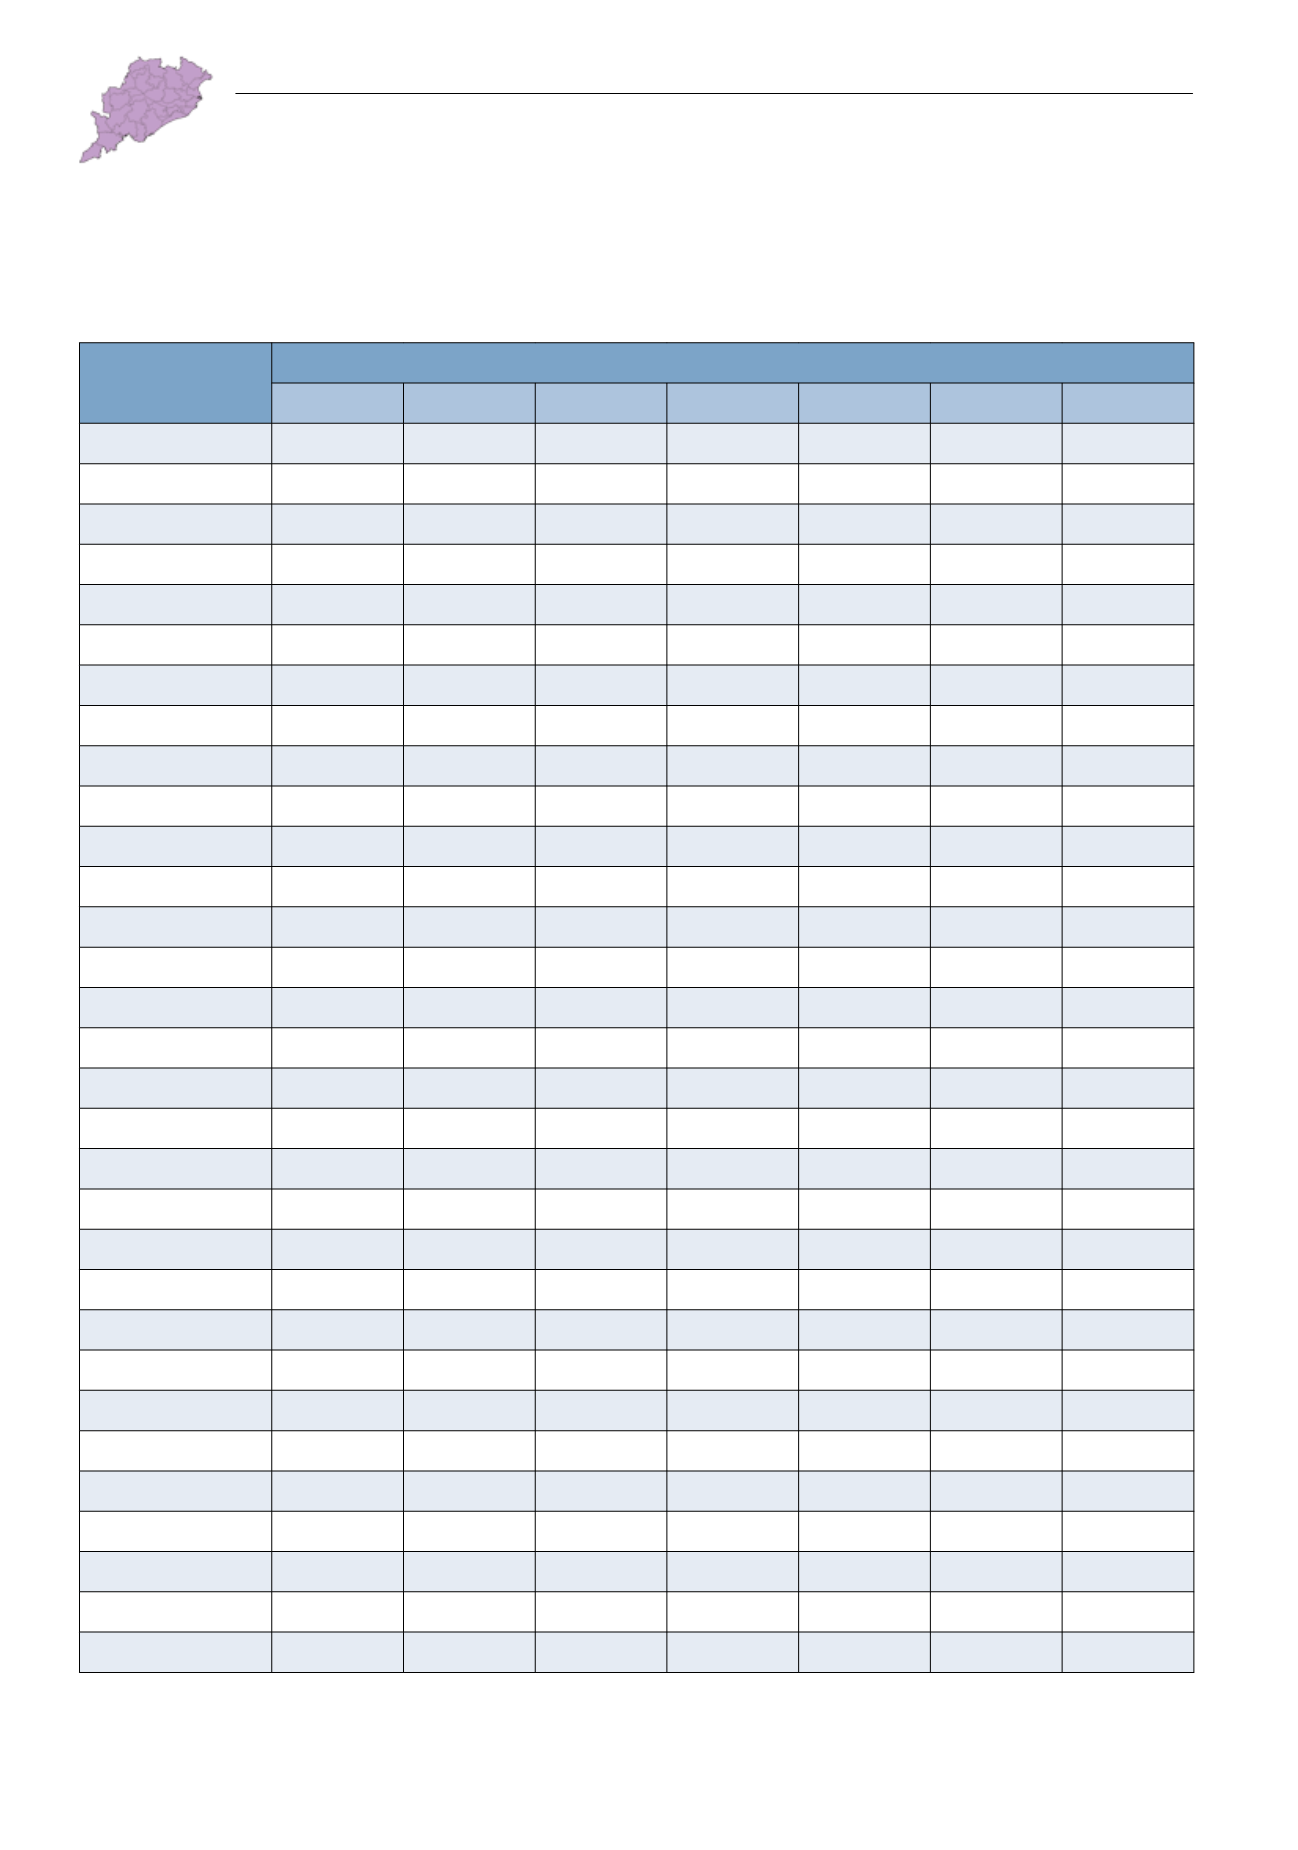
V.2. Service Delivery System - Artificial Insemination
TABLE V.2.3: District-wise AI Performed by Government Agencies – Bovine
Districts
Number of AI Performed
(‘000)
2007-08 2008-09 2009-10 2010-11 2011-12 2012-13 2013-14
ODISHA
749.3
828.9
932.8
955.2
926.2
942.9
973.5
Anugul
24.5
28.0
30.8
31.0
33.9
26.5
28.3
Balangir
29.2
31.7
34.6
36.2
40.4
29.7
31.5
Baleshwar
37.1
41.2
57.9
61.5
61.9
64.3
64.3
Bargarh
37.6
36.8
38.3
39.0
40.9
35.5
38.8
Baudh
9.5
11.4
11.6
12.0
12.4
9.0
7.4
Bhadrak
27.5
30.2
34.7
38.7
37.8
37.6
36.9
Cuttack
85.1
89.2
92.8
95.0
86
70.9
80.4
Debagarh
5.4
5.7
6.7
7.4
7.0
7.7
9.8
Dhenkanal
25.6
29.3
31.4
32.6
32.1
31.6
29.8
Gajapati
7.5
7.8
8.1
8.5
7.7
7.9
6.4
Ganjam
46.6
50.7
54.0
52.2
46.3
43.7
42.2
Jagatsinghapur
48.2
50.4
55.7
57.1
55.6
53.8
57.9
Jajapur
29.6
34.2
41.6
44.9
41.7
38.0
41.6
Jharsuguda
8.7
9.6
10.0
9.0
8.8
8.0
8.3
Kalahandi
23.0
26.8
27.2
28.2
29.8
27.2
26.8
Kandhamal
9.6
9.5
11.7
9.2
9.4
10.5
10.3
Kendrapara
35.6
38.5
47.7
50.1
48.7
44.6
48.3
Kendujhar
26.8
30.0
41.3
43.2
40.0
33.5
35.2
Khordha
26.6
31.2
35.8
38.4
36.6
34.1
34.0
Koraput
13.2
16.2
17.4
17.0
18.0
17.3
16.7
Malkangiri
3.9
5.1
5.2
4.7
4.3
4.6
4.4
Mayurbhanj
35.9
39.0
52.4
52.9
45.7
45.7
43.7
Nabarangapur
9.6
11.0
12.2
12.7
15.4
12.2
11.2
Nayagarh
16.8
19.4
20.9
21.1
19.8
19.1
22.5
Nuapada
8.2
10.6
10.1
9.7
10.4
8.6
9.0
Puri
48.2
49.0
51.2
49.6
45.0
37.4
39.5
Rayagada
9.7
10.8
11.1
10.8
10.0
12.4
13.2
Sambalpur
21.0
26.9
28.4
31.2
31.6
26.0
28.5
Subarnapur
13.5
17.5
18.7
18.8
19.2
12.8
13.4
Sundargarh
25.4
31.2
33.2
32.5
30.1
27.0
30.4
Source: Directorate of Animal Husbandry and Veterinary Services, Govt. of Odisha.