


 82 / 132

Dairying in Punjab
A Statistical Profile
2014
Part IV :
Milk Production
77
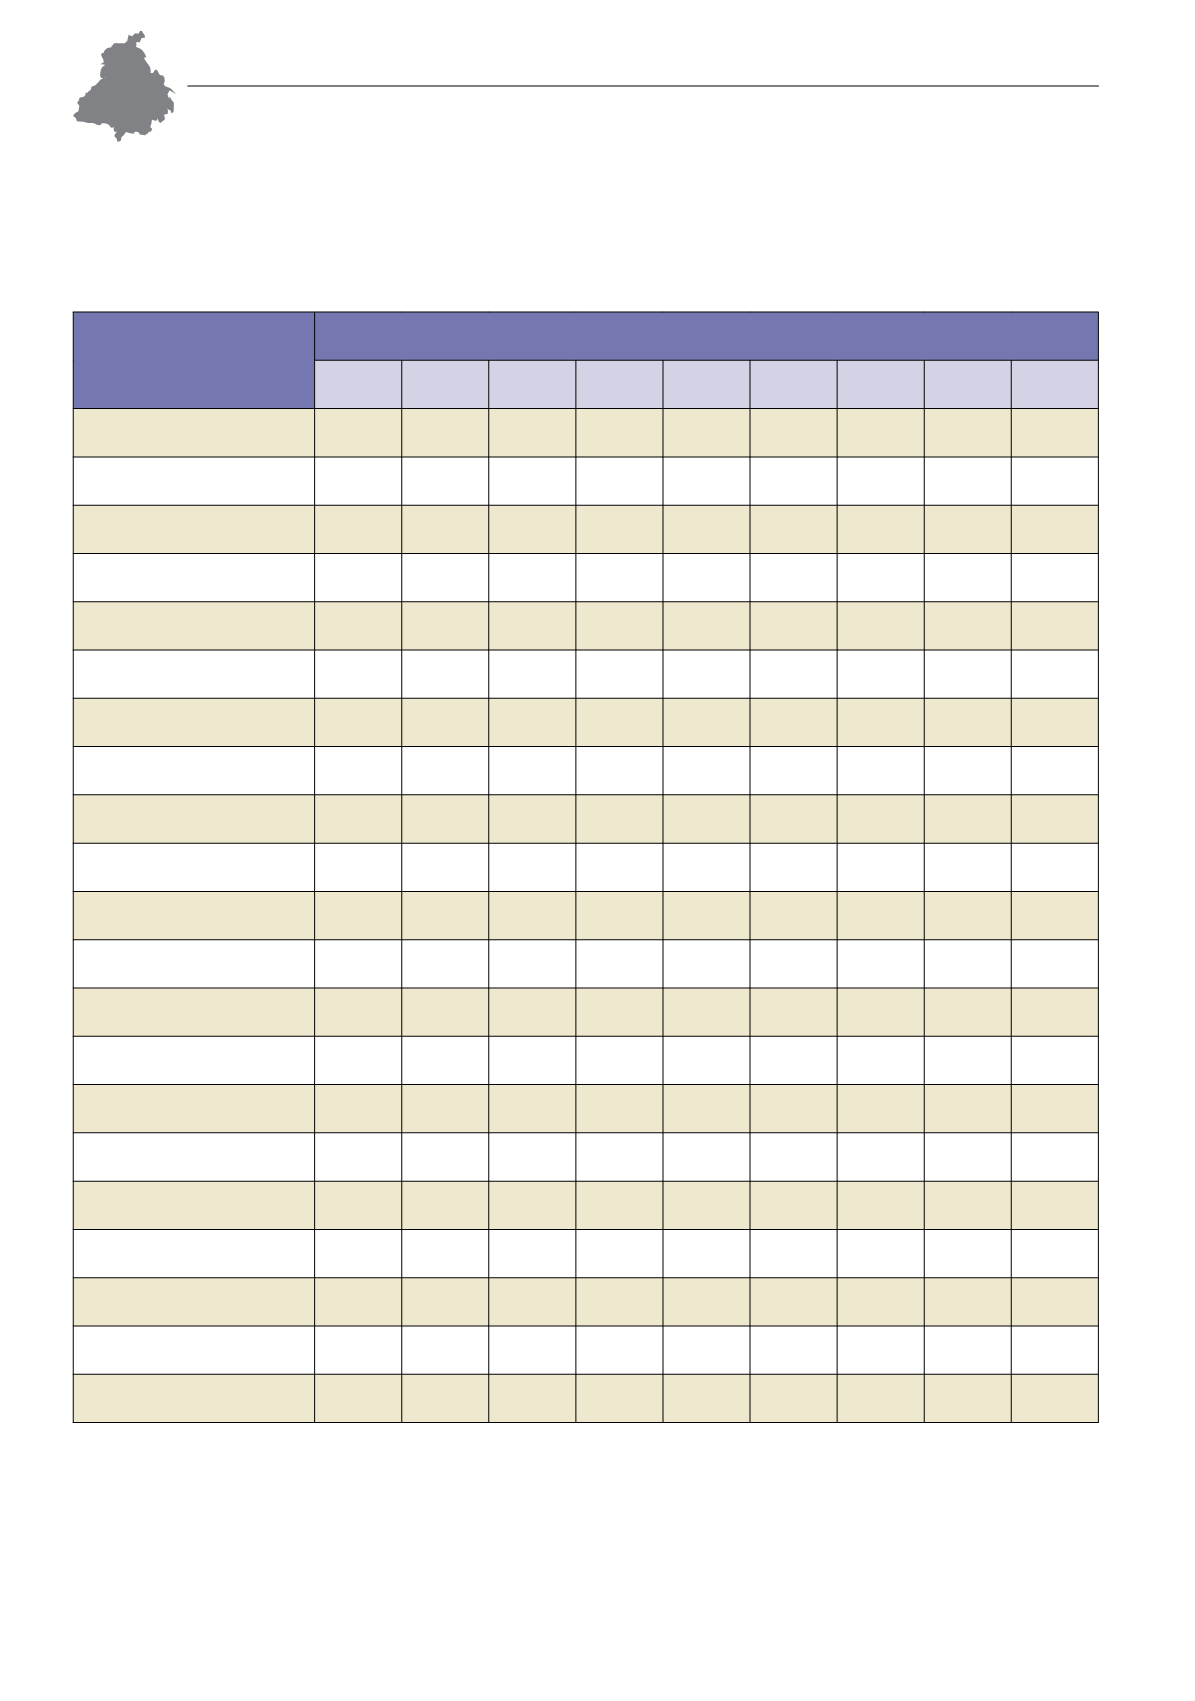
IV.4. ISS Figures: Milk Availability
TABLE IV.4.1: Year and District-wise Per Capita Milk Availability
Districts
Per Capita Availability of Milk
(grams/day)
1993-94 1997-98 2003-04 2007-08 2008-09 2009-10 2010-11 2011-12 2012-13
PUNJAB
772 860 915 962 960 950 936 937 942
Amritsar
797
880 1,042
796
938
941
909
786
835
Barnala
1,224
991 1,007
986 1,269 1,190
Bathinda
771 1,190
807 1,113
782
676
706
945
862
Faridkot
758
448 1,001 1,086 1,156 1,093 1,117 1,068 1,074
Fatehgarh Sahib
1,227 1,387 1,485 1,340 1,293 1,358 1,339 1,233 1,296
Firozpur
774
691 1,072
969 1,092 1,094
986 1,021 1,054
Gurdaspur
669
844
745
799
884
917
960
849
854
Hoshiarpur
698
892
763
838
850
830
810
849
873
Jalandhar
740
548
657
706
635
609
604
651
642
Kapurthala
715
656 1,237 1,057 1,269 1,253 1,192 1,029 1,101
Ludhiana
628
789
800
898
982
971
901
768
811
Mansa
1,196
982 1,221 1,082 1,015 1,091 1,108 1,206 1,175
Moga
625
977 1,065
926
936 1,004 1,194 1,208
Patiala
805 1,085
937
908
927
884
905
829
846
Rupnagar (Ropar)
529
582
745
925
692
631
636
844
843
Sangrur
967 1,069 1,094 1,297 1,221 1,197 1,193 1,301 1,268
SAS Nagar (Mohali)
879
911
902
803
688
702
SBS Nagar (Nawanshahr)
1,181 1,296 1,174 1,210 1,246 1,227 1,083 1,155
Muktsar
396
335
693
626
729
706 1,081
928
Tarn Taran
1,499 1,339 1,258 1,334 1,341 1,339
SOURCE: Estimated from Integrated Sample Survey Reports (1993-94 to 2012-13), Animal Husbandry Department, Govt. of Punjab.