


 7 / 137

2
Dairying in Tamil nadu
A Statistical Profile
2014
Part I :
General Statistics
National Dairy Development Board
I.1. Tamil Nadu at a Glance
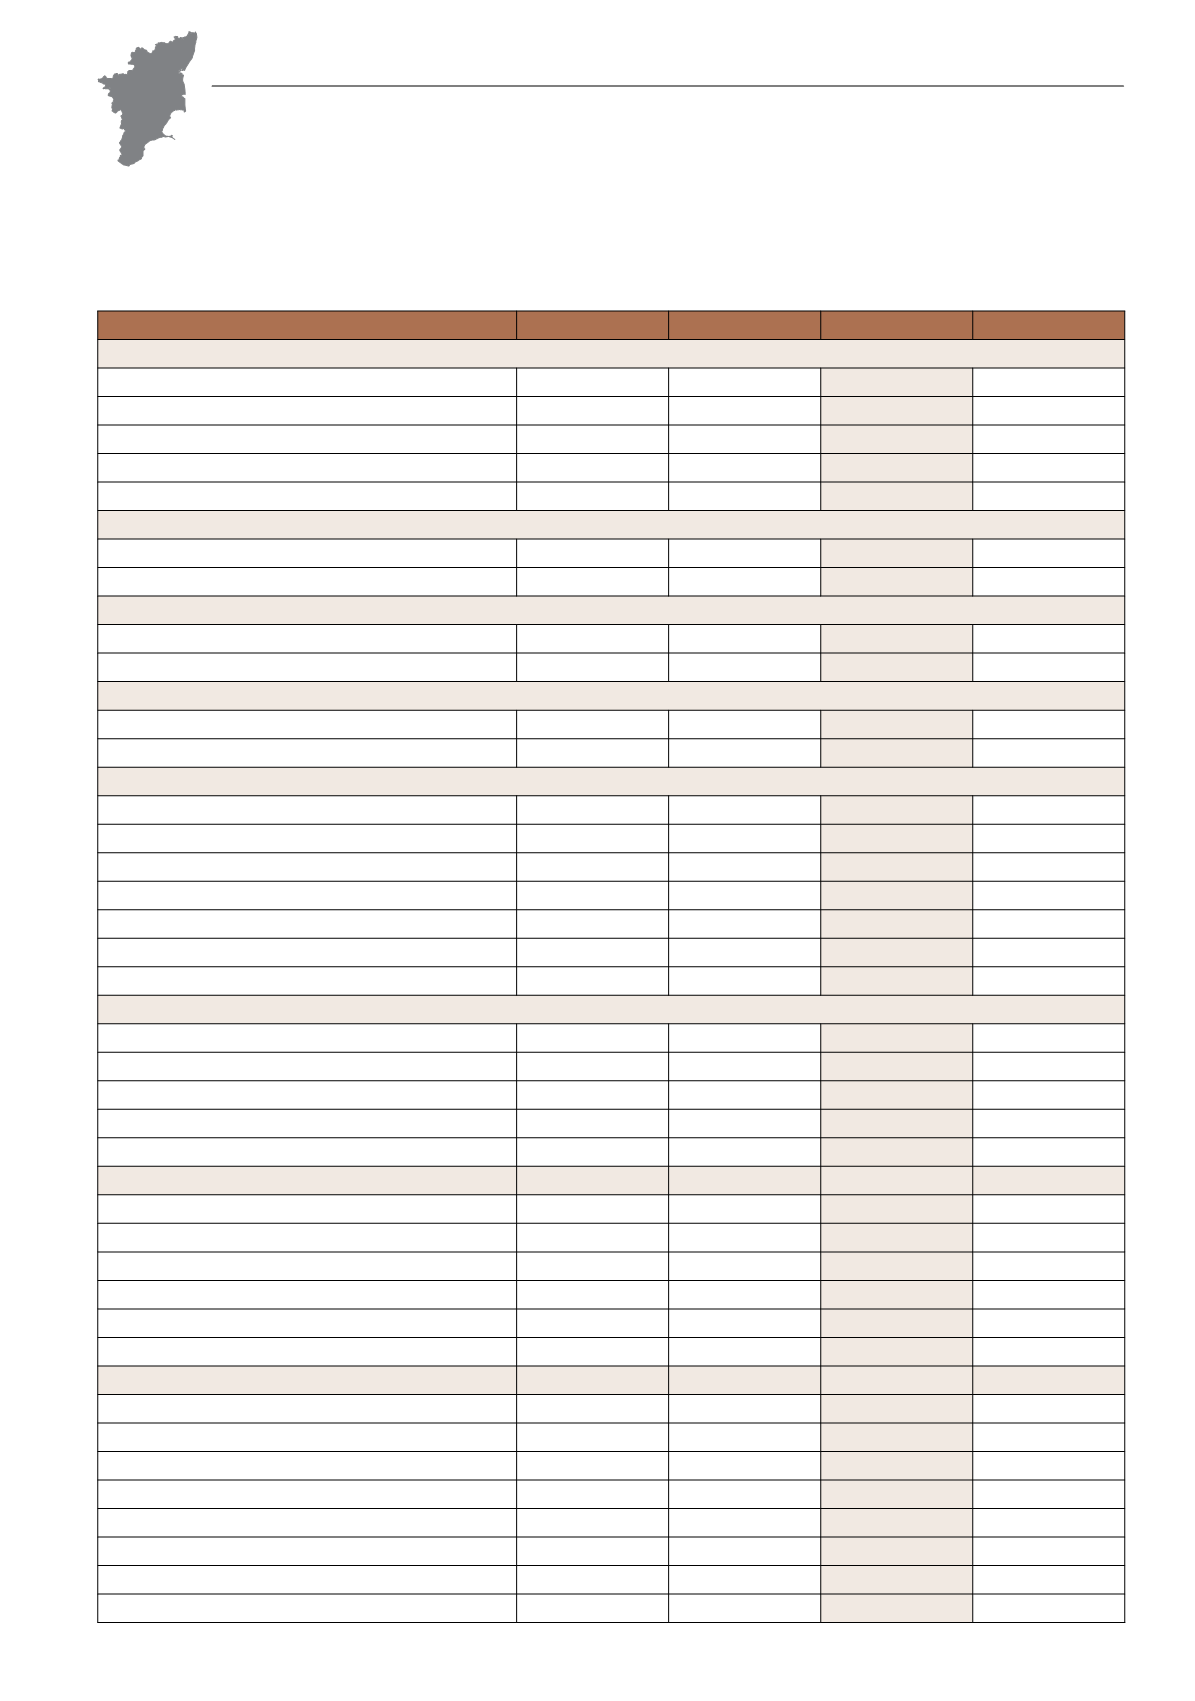
TABLE I.1.1: General Statistics: Tamil Nadu vs. India
Particulars
Unit
Year
Tamil Nadu
India
State Geography & Rural Infrastructure
Geographical Area
‘000 sq. km 2011
130.1
3,287.3
Districts
nos
2011
32
640
Sub-Districts
‘’
‘’
215
5,924
Villages
‘000
‘’
15.9
640.9
Households
million
‘’
18.5
249.4
Rural Households
2001
‘000
2001
8,284
137,414
2011
‘’
2011
9,528
168,565
Rural Households with Electricity
2001
%
2001
71
44
2011
‘’
2011
91
55
Rural Households with Tap water supply
2001
%
2001
60
24
2011
‘’
2011
80
31
Human Population
Population
million
2011
72.1
1,210.1
Urban (As % of total)
%
‘’
48.4
31.2
Rural (As % of total)
‘’
‘’
51.6
68.8
Density of Population
per sq. km
‘’
555
382
Scheduled Castes (As % of total)
%
‘’
20.0
16.6
Scheduled Tribes (As % of total)
‘’
‘’
1.1
8.6
Sex Ratio
Ratio
‘’
996
943
Literacy Rate (excluding population of 0 to 6 age group)
Male
%
2011
86.8
80.9
Female
‘’
‘’
73.4
64.6
Urban
‘’
‘’
87.0
84.1
Rural
‘’
‘’
73.5
67.8
Per Capita Income (at current prices)
`
2012-13
98,550
69,585
Livestock Population
million
2012
22.7
512.0
Bovine
‘’
‘’
9.6
299.9
Indigenous Cattle
‘’
‘’
2.5
151.2
Crossbred Cattle
‘’
‘’
6.4
39.7
Buffaloes
‘’
‘’
0.8
108.7
Small Ruminants
‘’
‘’
12.9
200.2
Poultry
‘’
‘’
117.3
729.2
Livestock Population
million
2007
30.8
529.7
Bovine
‘’
‘’
13.2
304.8
Indigenous Cattle
‘’
‘’
3.8
166.0
Crossbred Cattle
‘’
‘’
7.3
33.1
Buffaloes
‘’
‘’
2.0
105.3
Small Ruminants
‘’
‘’
17.2
212.1
Poultry
‘’
‘’
128.1
648.9
Number of Major Cattle Breeds
nos
‘’
3
30
Number of Major Buffalo Breeds
“
‘’
1
12