
105
National Dairy Development Board
Part VII :
Agriculture
Dairying in ODISHA
-
A Statistical Profile
2016
VII.3. Area and Production
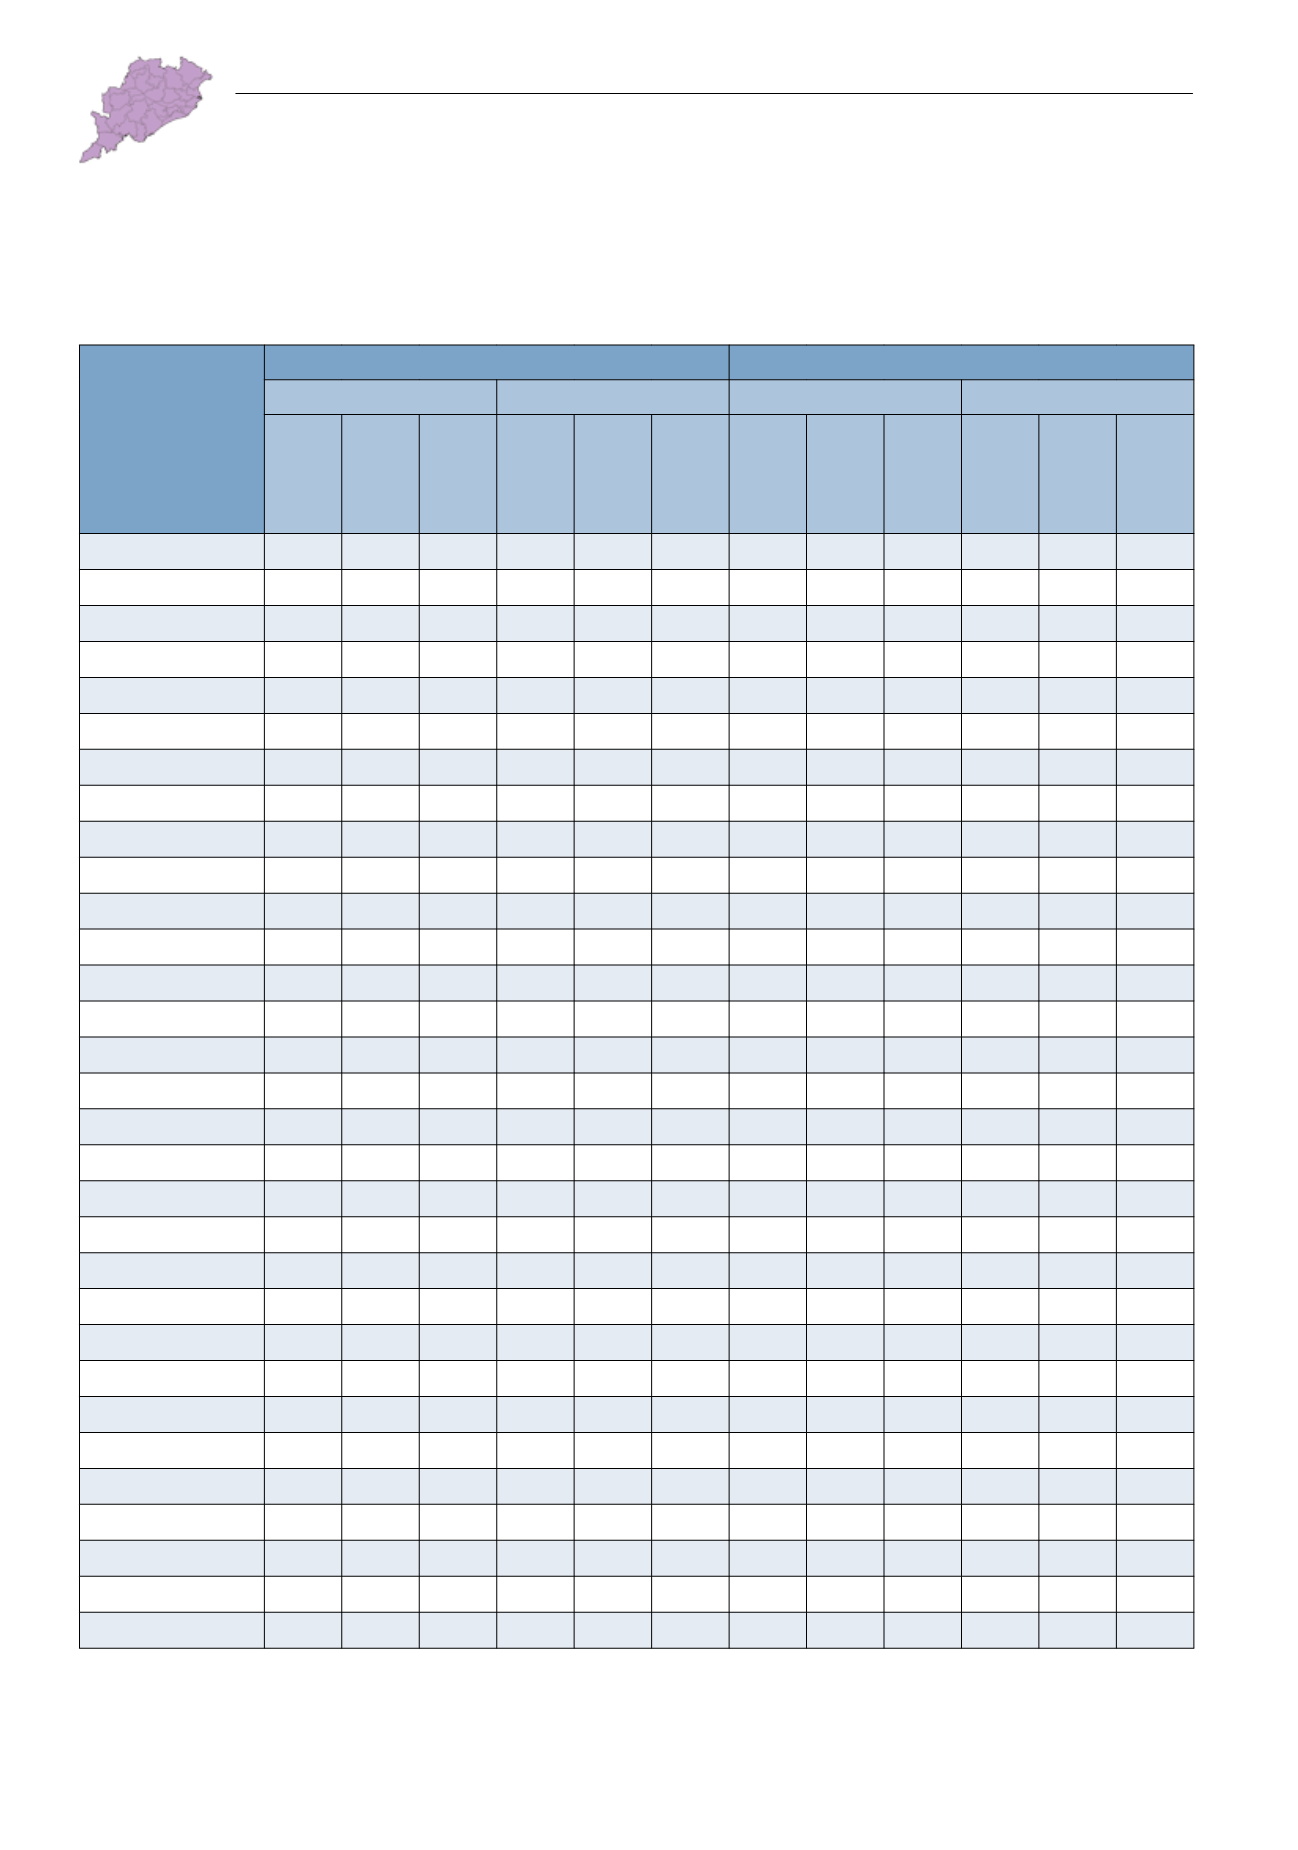
TABLE VII.3.2: District-wise Area and Production – Food Grains and Oilseeds
Districts
Food Grains
Oilseeds
Area
(‘000 ha)
Production
(‘000MT)
Area
(‘000 ha)
Production
(‘000MT)
*2007-12
2012-13
2013-14
*2007-12
2012-13
2013-14
*2007-12
2012-13
2013-14
*2007-12
2012-13
2013-14
Odisha
6,796 6,561 6,756 8,596 11,399 9,632 801 751 752 660 690 699
Anugul
201 191 187 147 233 212 60 58 56 35 40 39
Balangir
359 359 364 379 724 744 32 20 21 30 25 26
Baleshwar
262 225 245 428 375 292 21 27 30 27 39 35
Bargarh
386 383 410 702 998 784 40 36 37 48 42 41
Baudh
105 107 106 117 197 143
7
8
7
4
5
4
Bhadrak
190 179 192 325 362 258
5
6
8
6
7
9
Cuttack
254 246 237 305 442 237 16 17 16 21 24 23
Debagarh
69 71 76 64 130 137 20 19 13 10 10
7
Dhenkanal
175 157 167 214 264 284 35 35 35 27 30 30
Gajapati
95 94 100 105 123 94 13 12 13
8 10 11
Ganjam
558 552 566 625 653 300 48 44 62 47 44 64
Jagatsinghapur
140 129 137 191 238 188 11 10 10 17 17 17
Jajapur
198 190 202 226 252 175 36 37 36 59 63 61
Jharsuguda
73 62 58 74 117 65 14 13
9
8
8
5
Kalahandi
478 471 475 571 848 823 52 44 47 50 45 49
Kandhamal
98 91 93 107 116 123 30 28 32 10 11 12
Kendrapara
217 221 213 237 302 193 13 13 13 23 21 20
Kendujhar
295 275 276 353 377 376 37 34 32 14 16 15
Khordha
160 139 157 201 230 109
7
5
6
9
6
7
Koraput
266 266 275 334 399 517 46 35 30 17 14 13
Malkangiri
140 129 131 165 221 212 47 49 47 46 53 49
Mayurbhanj
395 363 386 534 556 488 32 30 34 20 25 27
Nabarangapur
240 237 240 449 534 664
8
5
5
5
3
3
Nayagarh
178 185 191 168 255 136
8
9
8
4
4
4
Nuapada
213 208 223 201 269 281 32 31 35 27 29 33
Puri
229 211 198 263 379 230 18 22 19 30 38 34
Rayagada
167 154 167 220 237 290 32 30 29 13 14 14
Sambalpur
203 197 214 291 455 360 34 29 15 17 14
8
Subarnapur
170 181 183 303 587 445 10 12 12
9 13 14
Sundargarh
284 283 291 298 528 472 36 35 36 20 21 21
* Average from 2007-08 to 2011-12.
Zero denotes either nil or negligible.
Source: Odisha Agriculture Statistics (2007-08 to 2013-14), Directorate of Agriculture and Food Production, Govt. of Odisha.


