


 112 / 127

107
National Dairy Development Board
Part VII :
Agriculture
Dairying in ODISHA
-
A Statistical Profile
2016
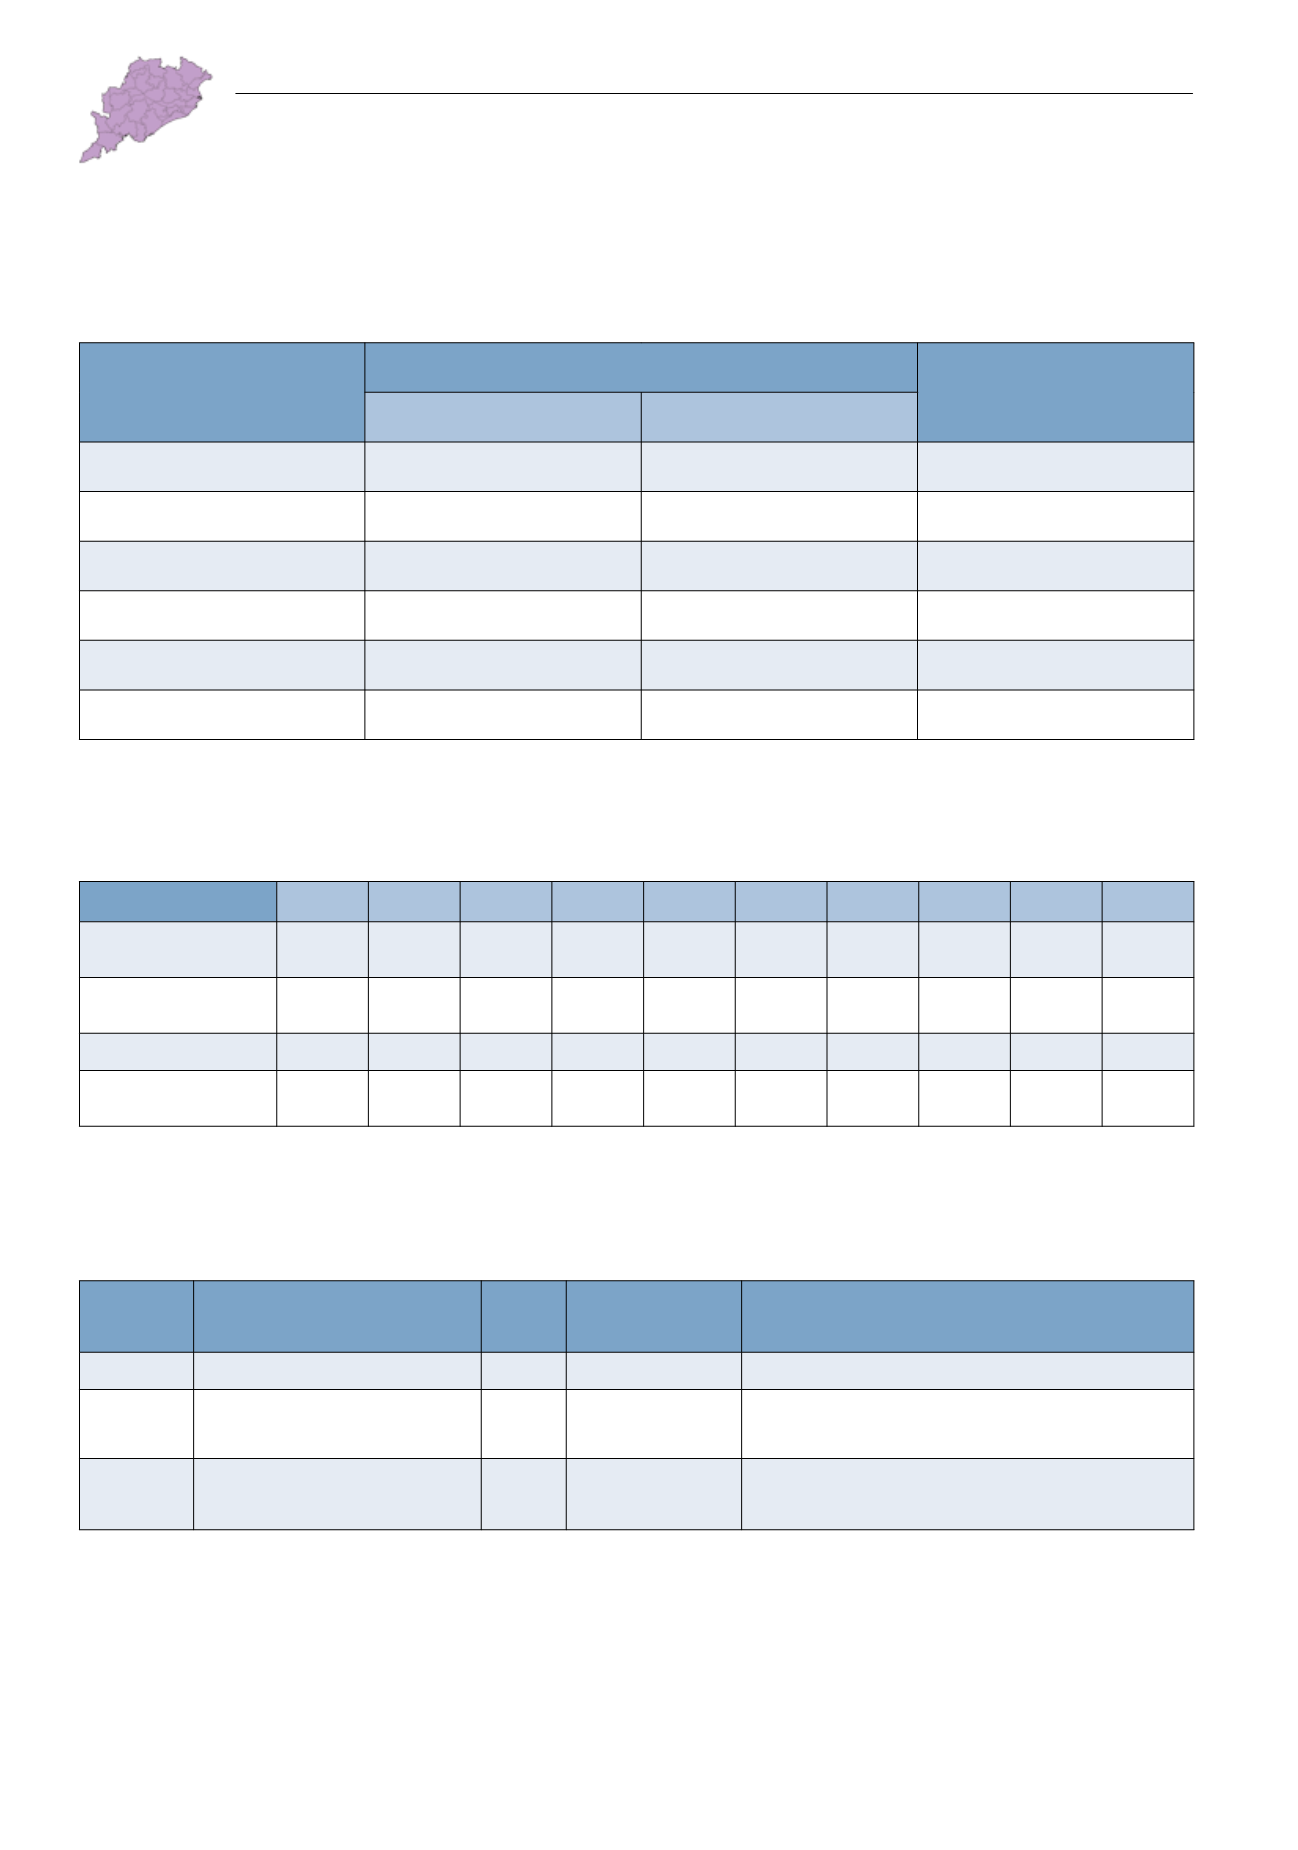
VII.4. Land Holding andWater Resources
TABLE VII.4.1: Operational Holdings in Odisha
Size of Holding
(ha)
Total Holdings
Average Size of Holding
(ha)
Number
(‘000)
Area
(‘000 ha)
Marginal
(<1 ha)
3,368.3
1,921.8
0.57
Small
(1-2 ha)
918.6
1,497.8
1.63
Semi-medium
(2-4 ha)
311.3
918.9
2.95
Medium
(4-10 ha)
63.7
381.3
5.99
Large
(>10 ha)
5.6
132.2
23.72
All Classes
4,667.5
4,852.0
1.04
Source: Agricultural Census Database, 2010-11, Ministry of Agriculture & Farmers Welfare, Govt. of India.
TABLE VII.4.2: Net Irrigated Area under Different Sources of Irrigation
(‘000 ha)
Particulars
1997-98 2001-02 2003-04 2007-08 2008-09 2009-10 2010-11 2011-12 2012-13 2013-14
Net Irrigated Area 1,401 1,752 1,737 2,027 2,081 2,058 2,085 2,079 2,186 2,253
Gross Irrigated Area 2,318 2,546 2,518 3,308 3,177 3,038 3,106 3,087 3,365 3,521
Net Sown Area
6,122 5,845 5,795 5,624 5,604 5,574 5,421 5,292 5,331 5,424
Gross cropped Area 8,645 8,799 8,637 9,016 9,070 9,074 9,080 8,801 8,879 9,054
Source: Directorate of Economics and Statistics, Ministry of Agriculture and Farmers Welfare, Govt of India; Odisha Agriculture Statistics (2007-08 to
2013-14), Directorate of Agriculture and Food Production, Govt. of Odisha.
TABLE VII.4.3: Major River Basins of Odisha
Name of
the River
Origin
Length
(km)
Catchment Area
(sq km)
States Falling in the Catchment Area
Brahmani
Ranchi (Bihar)
799
39,033
Madhya Pradesh, Bihar and Odisha
Mahanadi Nazri Town (Madhya Pradesh)
851
141,589
Madhya Pradesh, Maharashtra, Bihar,
Chhattisgarh and Odisha
Godavari
Nasik (Maharashtra)
1,465
312,812
Maharashtra, Andhra Pradesh, Madhya Pradesh,
Odisha and Pondicherry
Source: Hydrology and Water Resources Information System for India, National Institute of Hydrology, Roorkee.