


 14 / 127

9
National Dairy Development Board
Dairying in ODISHA
-
A Statistical Profile
2016
Part I :
General Statistics
I.2. Social Statistics: Human Population
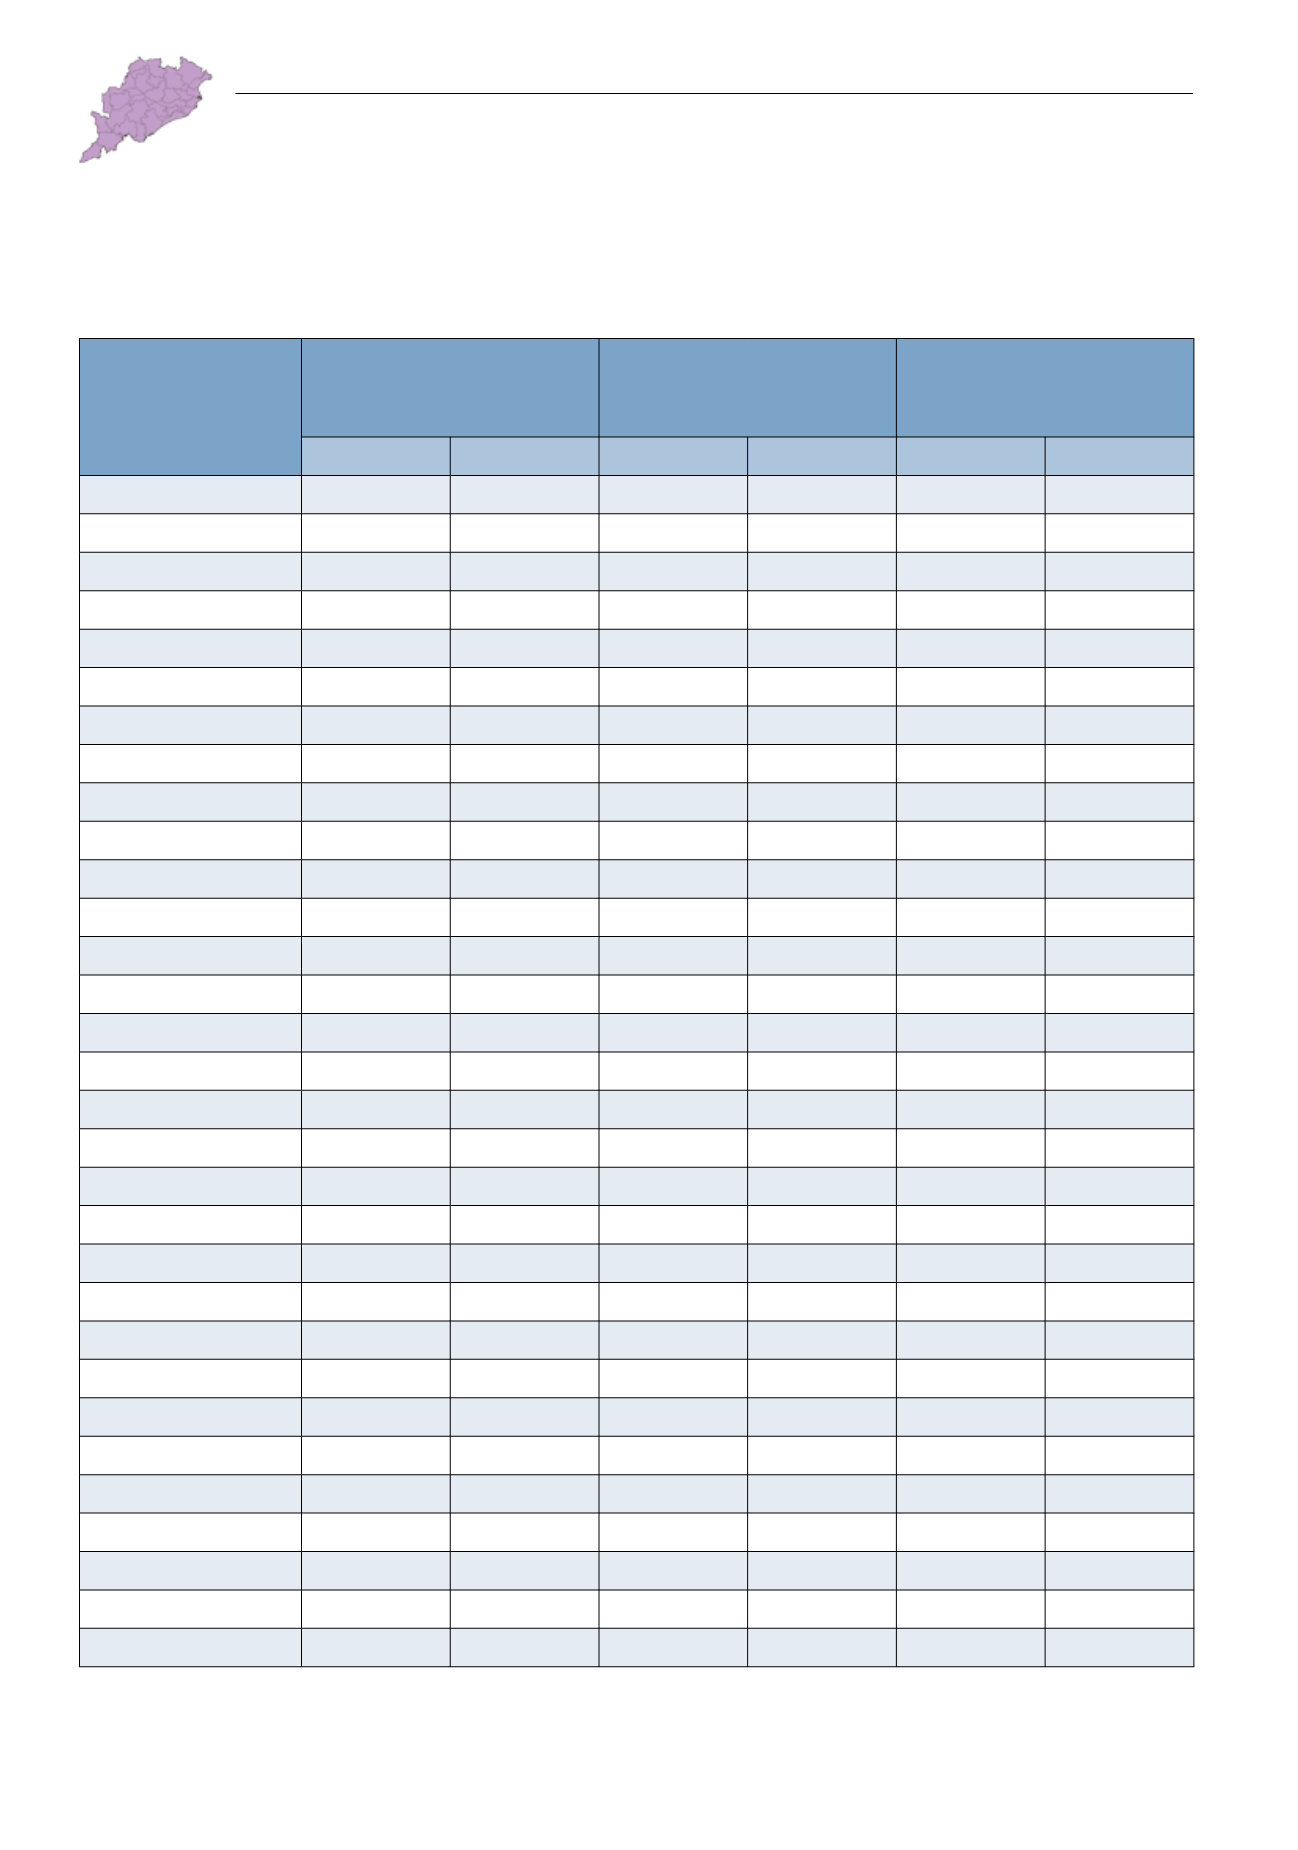
Table I.2.3: Rural Households, Electricity and TapWater Supply - 2001 and 2011
Districts
Rural Households
(‘000)
Rural Households with
Electricity
(‘000)
Rural Households with
TapWater
(inclusive –
treated & untreated) (‘000)
2001
2011
2001
2011
2001
2011
ODISHA
6,783
8,144
1,312
2,895
188
609
Anugul
195.5
249.6
41.3
94.8
7.3
18.1
Balangir
306.1
387.3
30.5
87.9
11.1
25.9
Baleshwar
362.4
473.5
99.4
249.4
8.7
45.6
Bargarh
280.4
339.4
70.4
136.8
12.5
51
Baudh
81.2
103.2
8.6
15.8
1.3
2
Bhadrak
220
274.2
48.7
138.1
7.1
9.9
Cuttack
352.9
425.1
107.6
219.8
7.5
32.3
Debagarh
54
70.5
4.8
18.5
0.4
3
Dhenkanal
206.8
253.1
46.4
97.4
5.2
10.7
Gajapati
101.8
112.9
12
50.5
3.6
17.8
Ganjam
564.7
602.2
149.5
278.2
22.4
105.3
Jagatsinghapur
207.9
237.4
35.6
121.6
8.5
15.1
Jajapur
328.2
378.1
92.7
169
7.4
16.1
Jharsuguda
69
83.7
21.8
37.1
3.4
6.2
Kalahandi
304.5
377
29.8
70.1
4.7
12.6
Kandhamal
136.9
155.3
10.8
17
1.9
3.3
Kendrapara
278.2
311.5
66.7
159.8
5.4
18.8
Kendujhar
287.3
349.7
37.6
80.5
10
16.2
Khordha
202.4
247.9
76.8
142
4
23.2
Koraput
241.7
283.5
21.7
42.4
7.4
24.8
Malkangiri
102
126.3
6.7
17
2.1
5
Mayurbhanj
443
544.8
52.5
107
5.4
23
Nabarangapur
215
253.5
10.8
21.5
3.3
9.5
Nayagarh
174.9
213.3
42.9
111.1
5.8
28.1
Nuapada
123.4
151.9
12.9
37.9
5.6
12
Puri
255.8
317
61.8
155.3
6.6
15.1
Rayagada
165.2
191.6
18.4
33.6
6.5
20.2
Sambalpur
148.3
179
32.2
64
3.3
15.3
Sonapur
109.6
140.7
17.1
41.6
2.9
7
Sundargarh
263.8
310.8
44.7
79.6
6.9
15.4
Source: Census 2001 and 2011, Office of the Registrar General and Census Commissioner, Govt. of India, New Delhi.