


 9 / 127

4
National Dairy Development Board
Dairying in ODISHA
-
A Statistical Profile
2016
Part I :
General Statistics
I.1. Odisha at a Glance
TABLE I.1.1: General Statistics: Odisha vs. India
Particulars
Unit
Year
Odisha
India
Critical
‘’
‘’
0 (0)
3 (3)
Over Exploited
‘’
‘’
0 (0)
16 (14)
Salinity Affected
‘’
‘’
2 (2)
1(1)
Sources: Census 2001 & 2011, Office of the Registrar General and Census Commissioner, Govt. of India, New Delhi.
18
th
and 19
th
Livestock Census, Department of Animal Husbandry, Dairying and Fisheries, Ministry of Agriculture & Farmers Welfare, Govt. of India.
Minutes of the Meeting of Technical Committee on Direction for improvement of Animal Husbandry Statistics held during 4
th
to 5
th
June, 2015,
Department of Animal Husbandry, Dairying and Fisheries, Ministry of Agriculture & Farmers Welfare, Govt. of India.
Dynamic Ground Water Resources of India as on 31
st
March, 2009, 2011, Central Ground Water Board, Ministry of Water Resources, Govt. of India.
Directorate of Economics and Statistics, Ministry of Agriculture & Farmers Welfare, Govt. of India.
Ministry of Statistics and Programme Implementation, Govt. of India.
Odisha Economic Survey, 2014-15, Planning and Coordination Department, Govt. of Odisha.
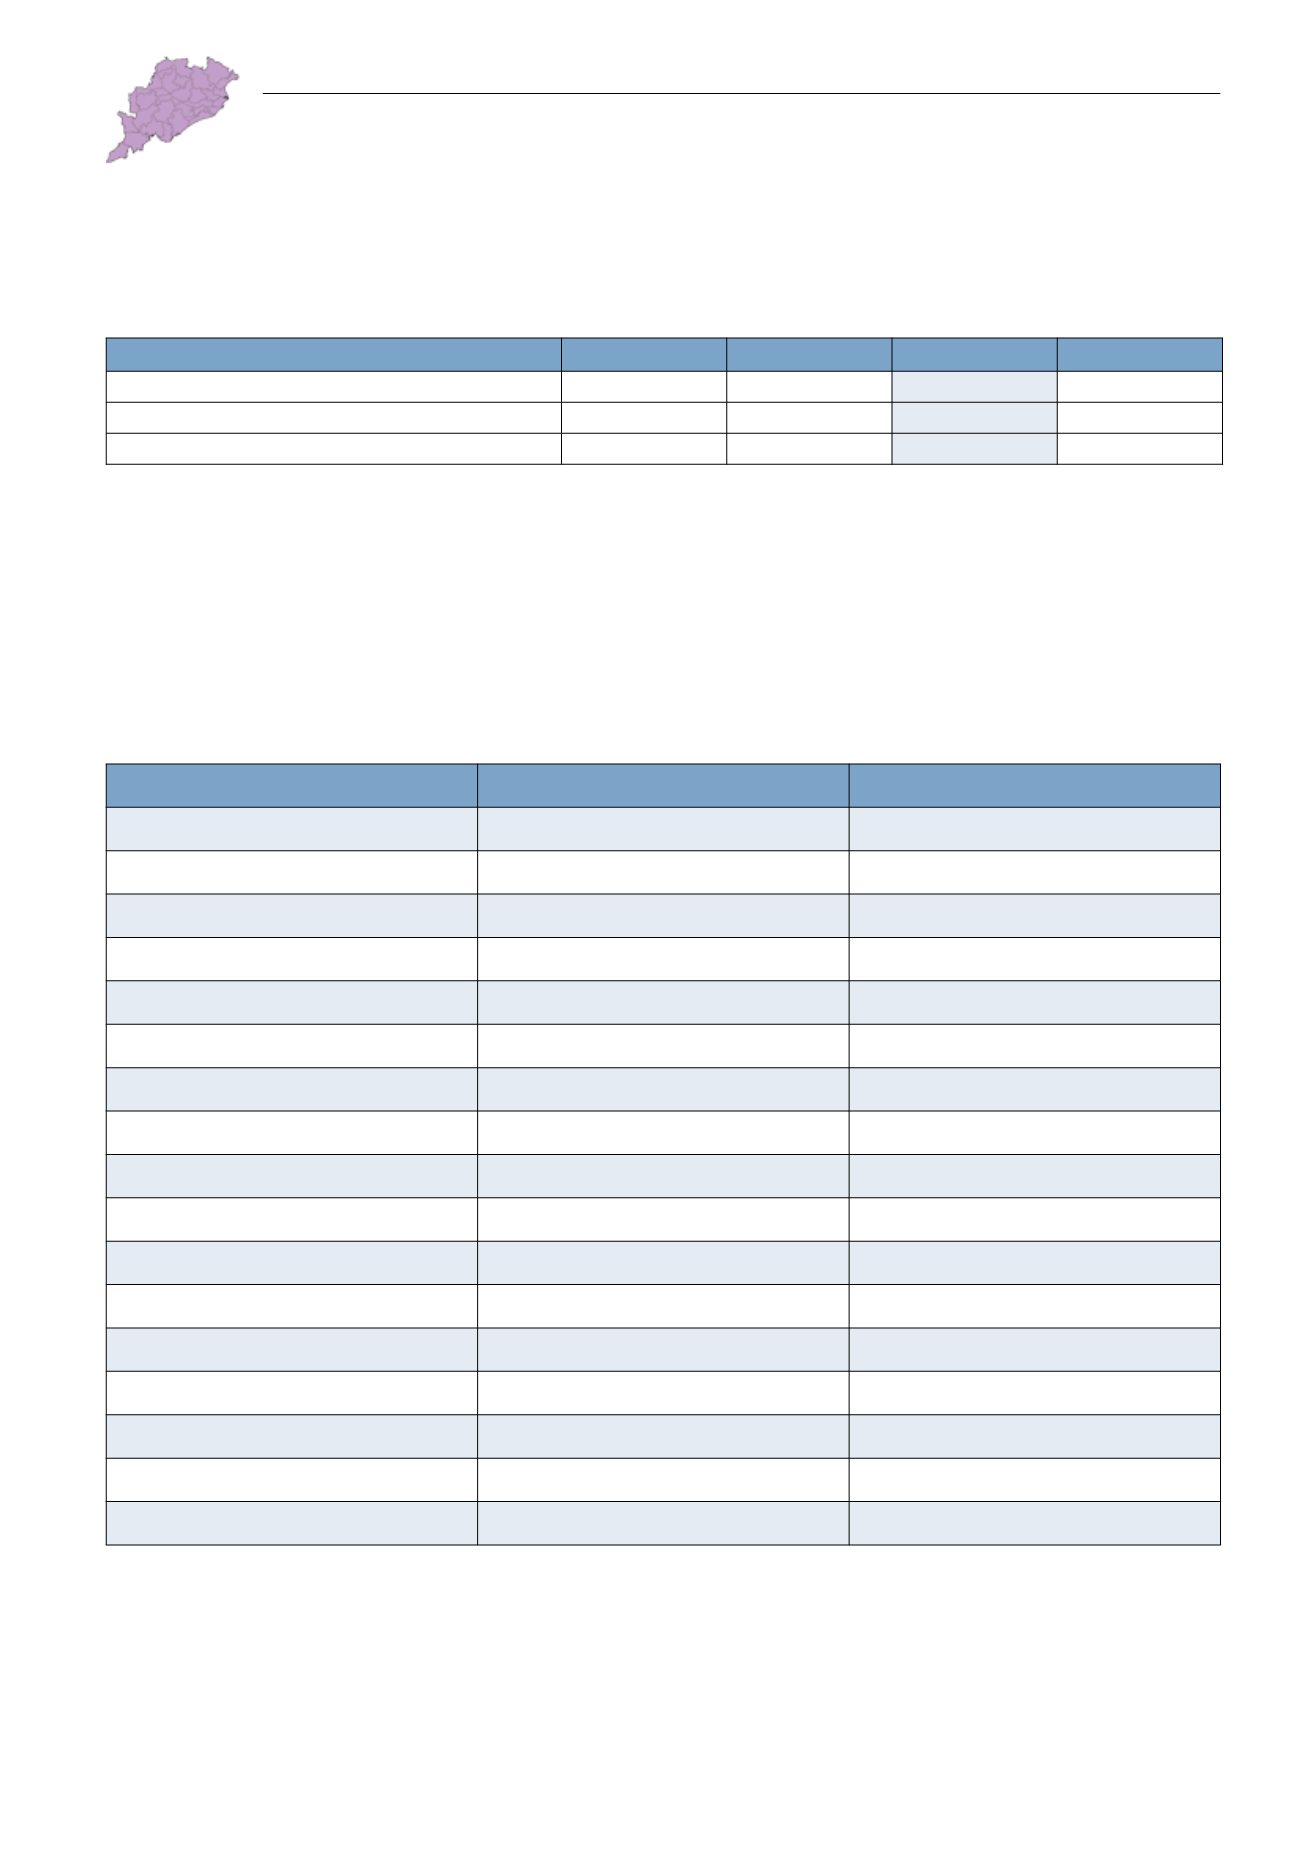
Table I.1.2: Formation of Districts in Odisha
New Districts
Year of Formation
Carved Out of
Anugul
1993
Dhenkanal
Bargarh
1993
Sambalpur
Baudh
1994
Kandhamal
Bhadrak
1993
Baleshwar
Debagarh
1994
Sambalpur
Gajapati
1992
Ganjam
Jagatsinghapur
1993
Cuttack
Jajapur
1993
Cuttack
Jharsuguda
1994
Sambalpur
Kendrapara
1993
Cuttack
Khordha
1993
Puri
Malkangiri
1992
Koraput
Nabarangapur
1992
Koraput
Nayagarh
1995
Puri
Nuapada
1993
Kalahandi
Rayagada
1992
Koraput
Subarnapur
1993
Balangir
Source: District Administration Websites of Govt. of Odisha.