


 8 / 127

3
National Dairy Development Board
Dairying in ODISHA
-
A Statistical Profile
2016
Part I :
General Statistics
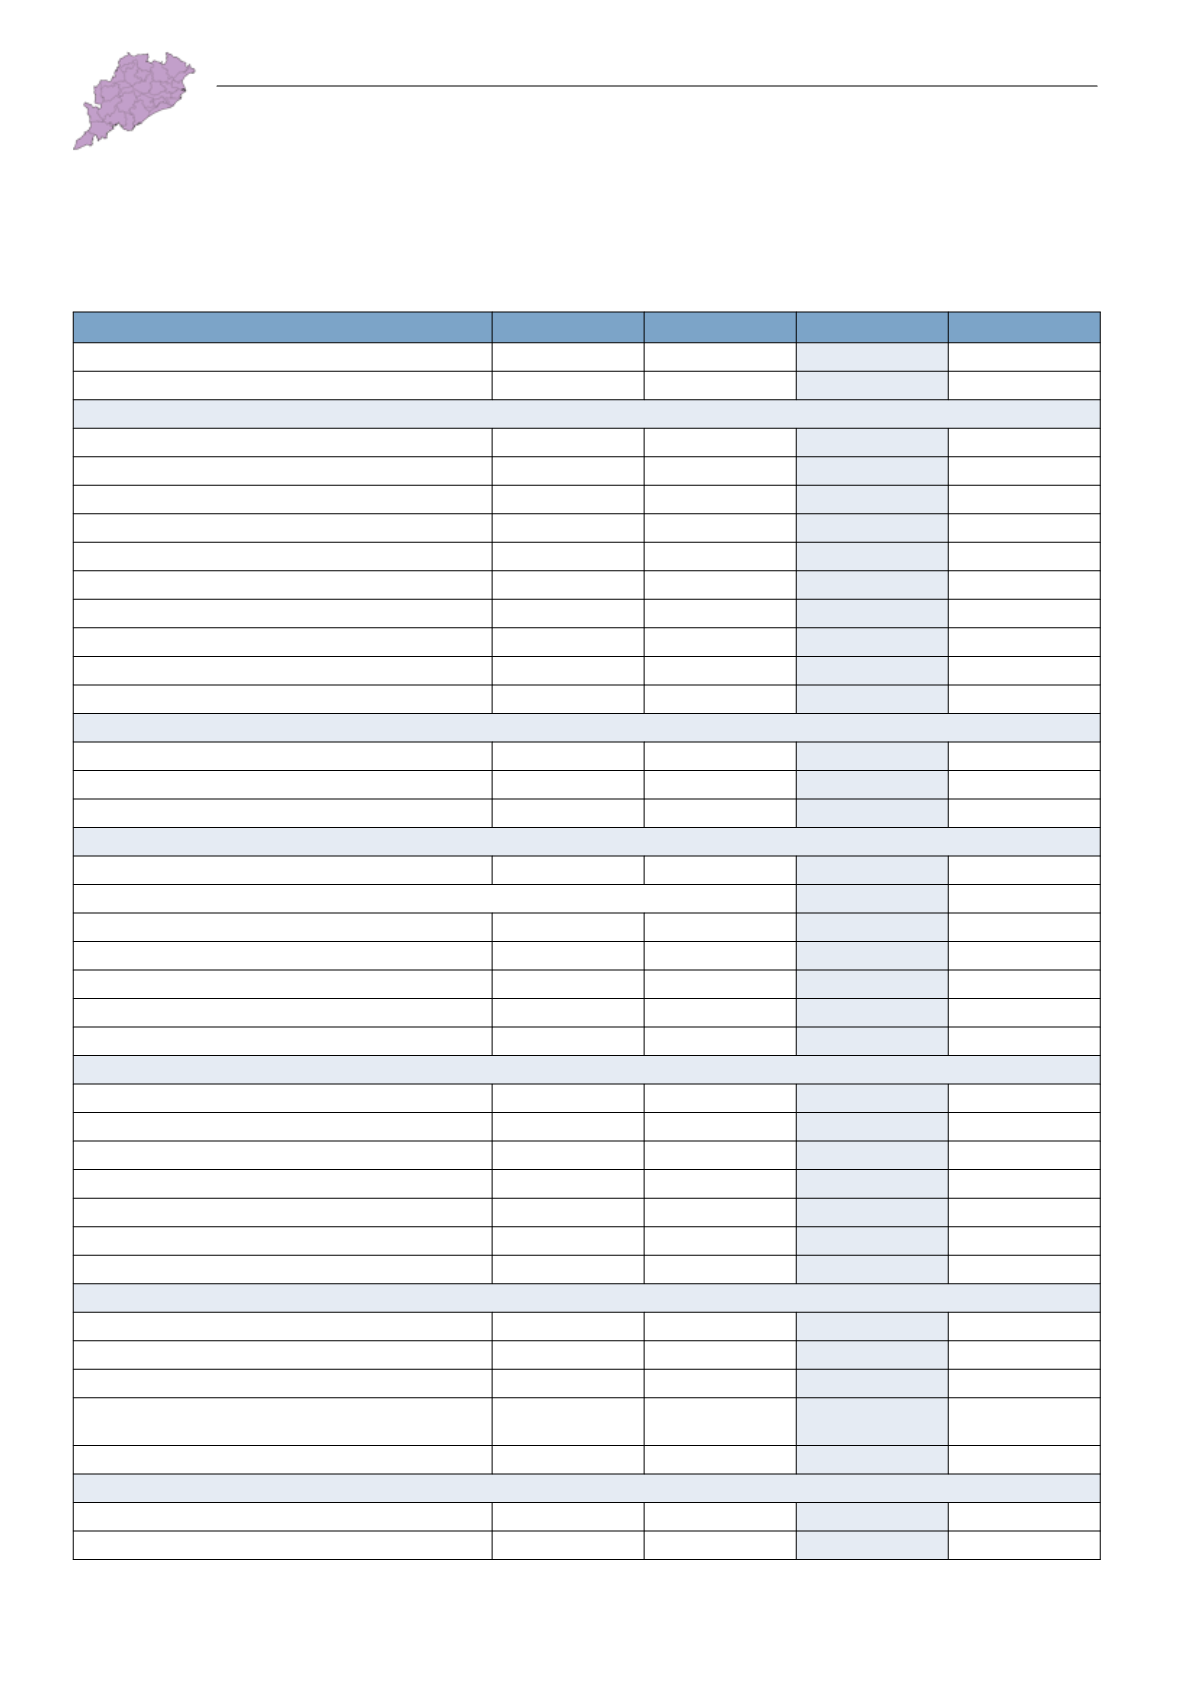
I.1. Odisha at a Glance
TABLE I.1.1: General Statistics: Odisha vs. India
Particulars
Unit
Year
Odisha
India
Number of Major Cattle Breeds
nos
2015
4
36
Number of Major Buffalo Breeds
"
‘’
2
13
Milk Production
Milk Production - Total
‘000 MT
2014-15
1,903
146,313
Crossbred Cattle
‘’
‘’
844
36,938
Indigenous Cattle
‘’
‘’
860
29,484
Buffaloes
‘’
‘’
194
74,709
Goats
‘’
‘’
4
5,180
Per Capita Milk Availability
grams/day
2013-14
117
307
Egg Production
million
2014-15
1,924
78,484
Estimated Meat Production
‘000 MT
‘’
162.5
6,691
Marine & Inland Fish Production
“
2013-14
413.8
9,579
Wool Production
‘000 kg
2014-15
-
48,139
Veterinary Infrastructure
Veterinary Institutes
nos
2013-14
3,479
60,896
Semen Stations
‘’
‘’
1
57
AI Centers
‘’
‘’
5,826
83,796
Veterinary Services
AI Done
‘000
2013-14
1,435
58,532
Vaccination Done
H.S. Vaccination
‘’
2013-14
8,282
B.Q. Vaccination
‘’
‘’
5,297
FMD Vaccination
‘’
‘’
2,663
Total Treatment
‘’
‘’
7,658
Total Castration
‘’
‘’
556
Agricultural Resources
Forest Cover
%
2012-13
37.3
21.30
Pasture and Grazing Land
‘000 ha
‘’
536
10,240
As %of total reporting area
%
‘’
3.5
3.3
Area Under Fodder Crops
‘000 ha
‘’
-
9,188
Gross Irrigated Area As % Gross Cropped Area
%
‘’
38.0
47.6
Cropping Intensity
%
‘’
166
139
Irrigation Intensity
%
‘’
154
138
Production of Major Crops
Cereals
‘000 MT
2013-14
8,574
245,790
Pulses
‘’
‘’
1,058
19,253
Oilseeds
‘’
‘’
699
32,749
Cotton
‘000 bales (170
kg Each)
‘’
299
35,902
Sugarcane
‘000 MT
‘’
2,544
352,142
GroundWater Status
Safe
% of Blocks
2011 & (2009)
98 (98)
69 (73)
Semi Critical
‘’
‘’
0 (0)
11 (9)