


 16 / 132

Dairying in Punjab
A Statistical Profile
2014
Part I :
General Statistics
11
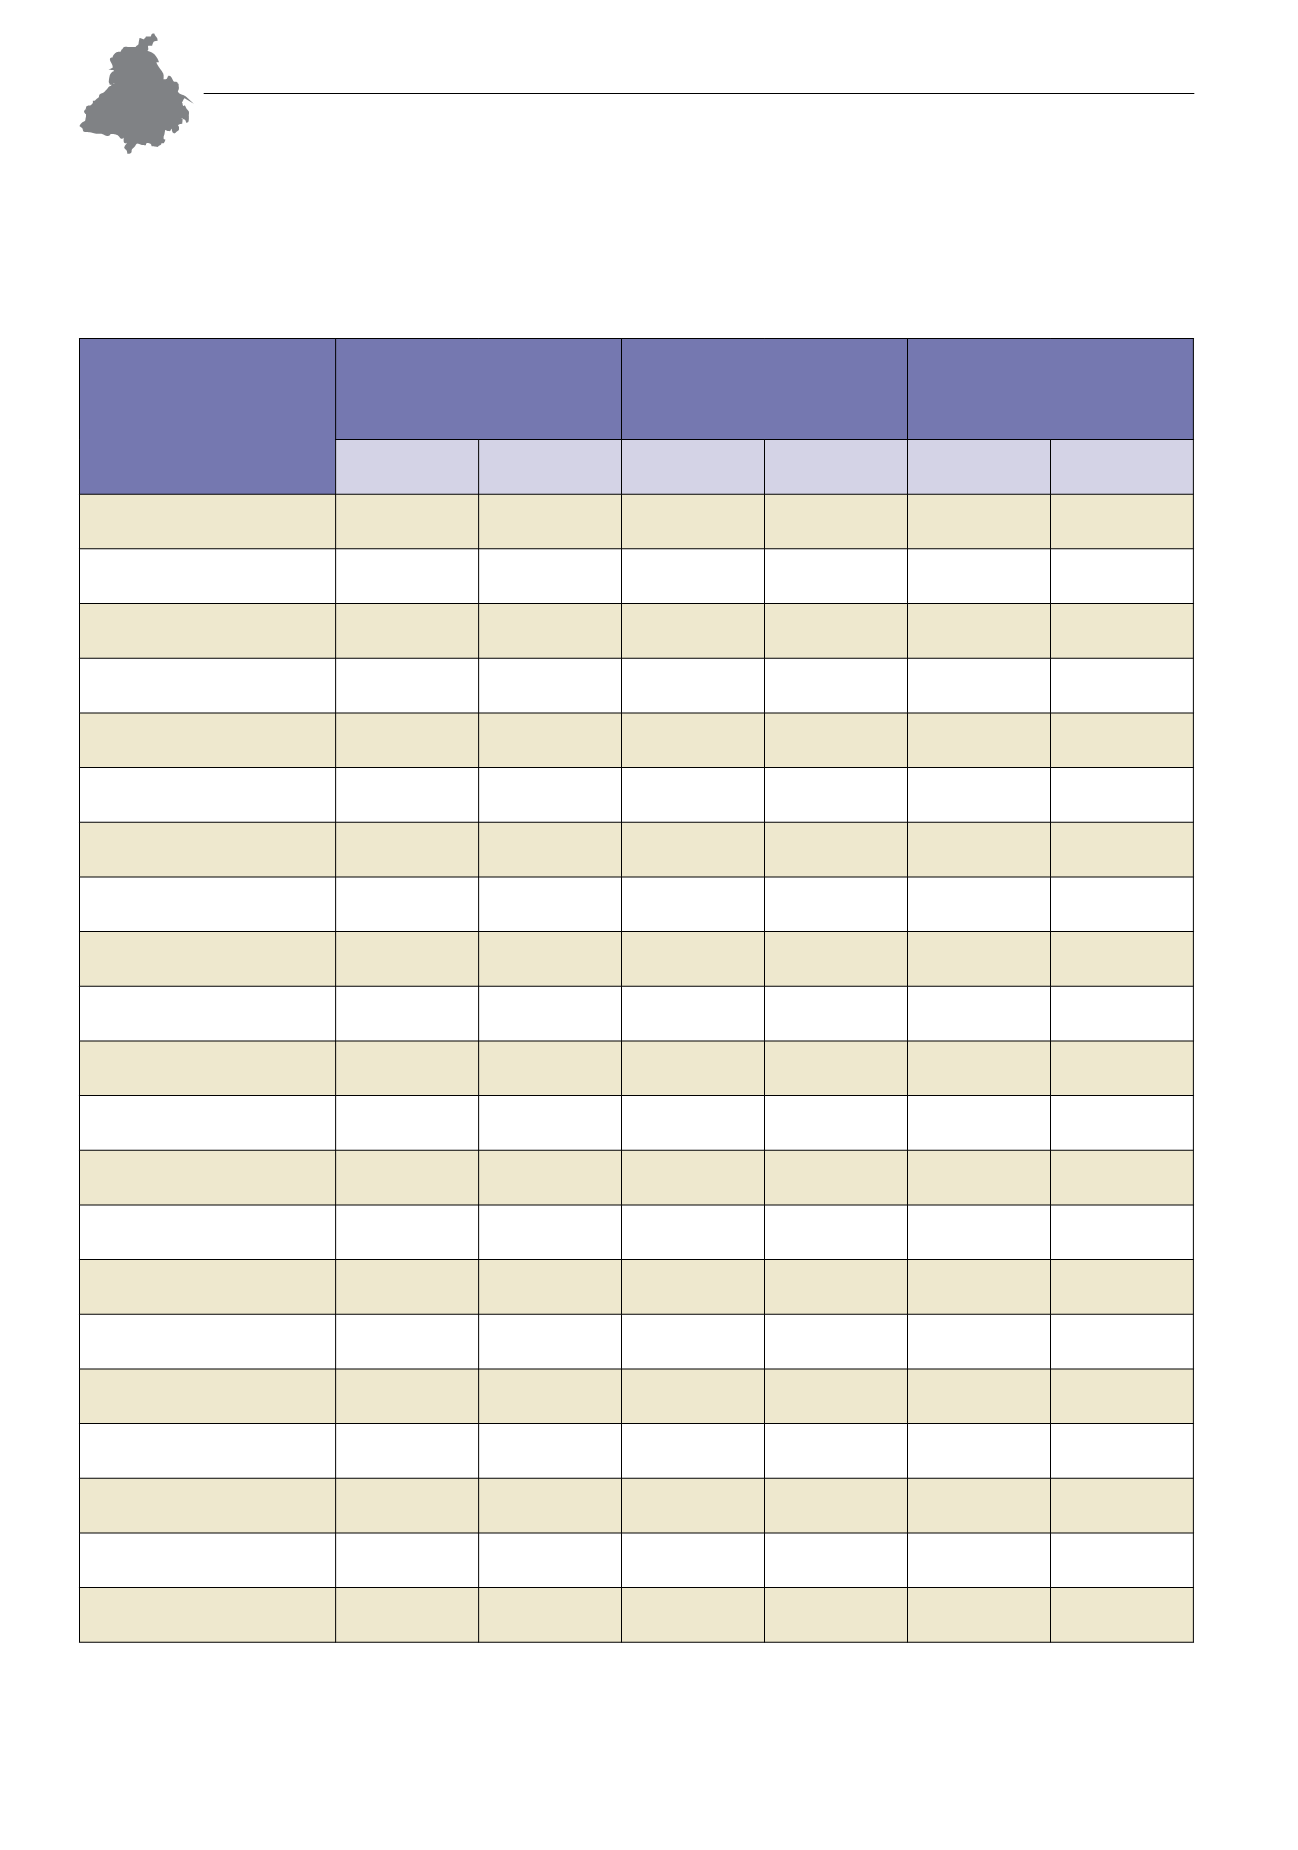
I.2. Social Statistics: Human Population
Table I.2.4: Rural Households, Electricity and TapWater Supply - 2001 and 2011
Districts
Rural Households (‘000)
Rural Households with
Electricity
(‘000)
Rural Households with
TapWater
(inclusive –
treated & untreated)
(‘000)
2001
2011
2001
2011
2001
2011
PUNJAB
2,798
3,359
2,482
3,165
437
1,158
Amritsar
317
215
270
198
23
29
Barnala
77
72
30
Bathinda
143
171
118
163
26
81
Faridkot
62
77
54
73
12
26
Fatehgarh Sahib
65
79
62
76
6
22
Firozpur
220
277
180
250
45
84
Gurdaspur
269
312
228
292
37
57
Hoshiarpur
222
265
207
250
52
120
Jalandhar
187
214
178
208
22
79
Kapurthala
90
108
84
103
8
39
Ludhiana
236
281
221
272
20
77
Mansa
95
117
77
109
17
57
Moga
121
147
110
139
15
57
Patiala
204
214
182
202
32
91
Rupnagar (Ropar)
130
98
121
93
37
52
Sangrur
243
218
218
208
29
73
SAS Nagar (Mohali)
85
79
55
SBS Nagar (Nawanshahr)
93
103
88
99
18
45
Muktsar
101
124
84
118
38
65
Tarn Taran
177
161
19
Source: Census 2001 and 2011, Office of the Registrar General and Census Commissioner, Govt. of India, New Delhi.