


 14 / 132

Dairying in Punjab
A Statistical Profile
2014
Part I :
General Statistics
9
I.2. Social Statistics: Human Population
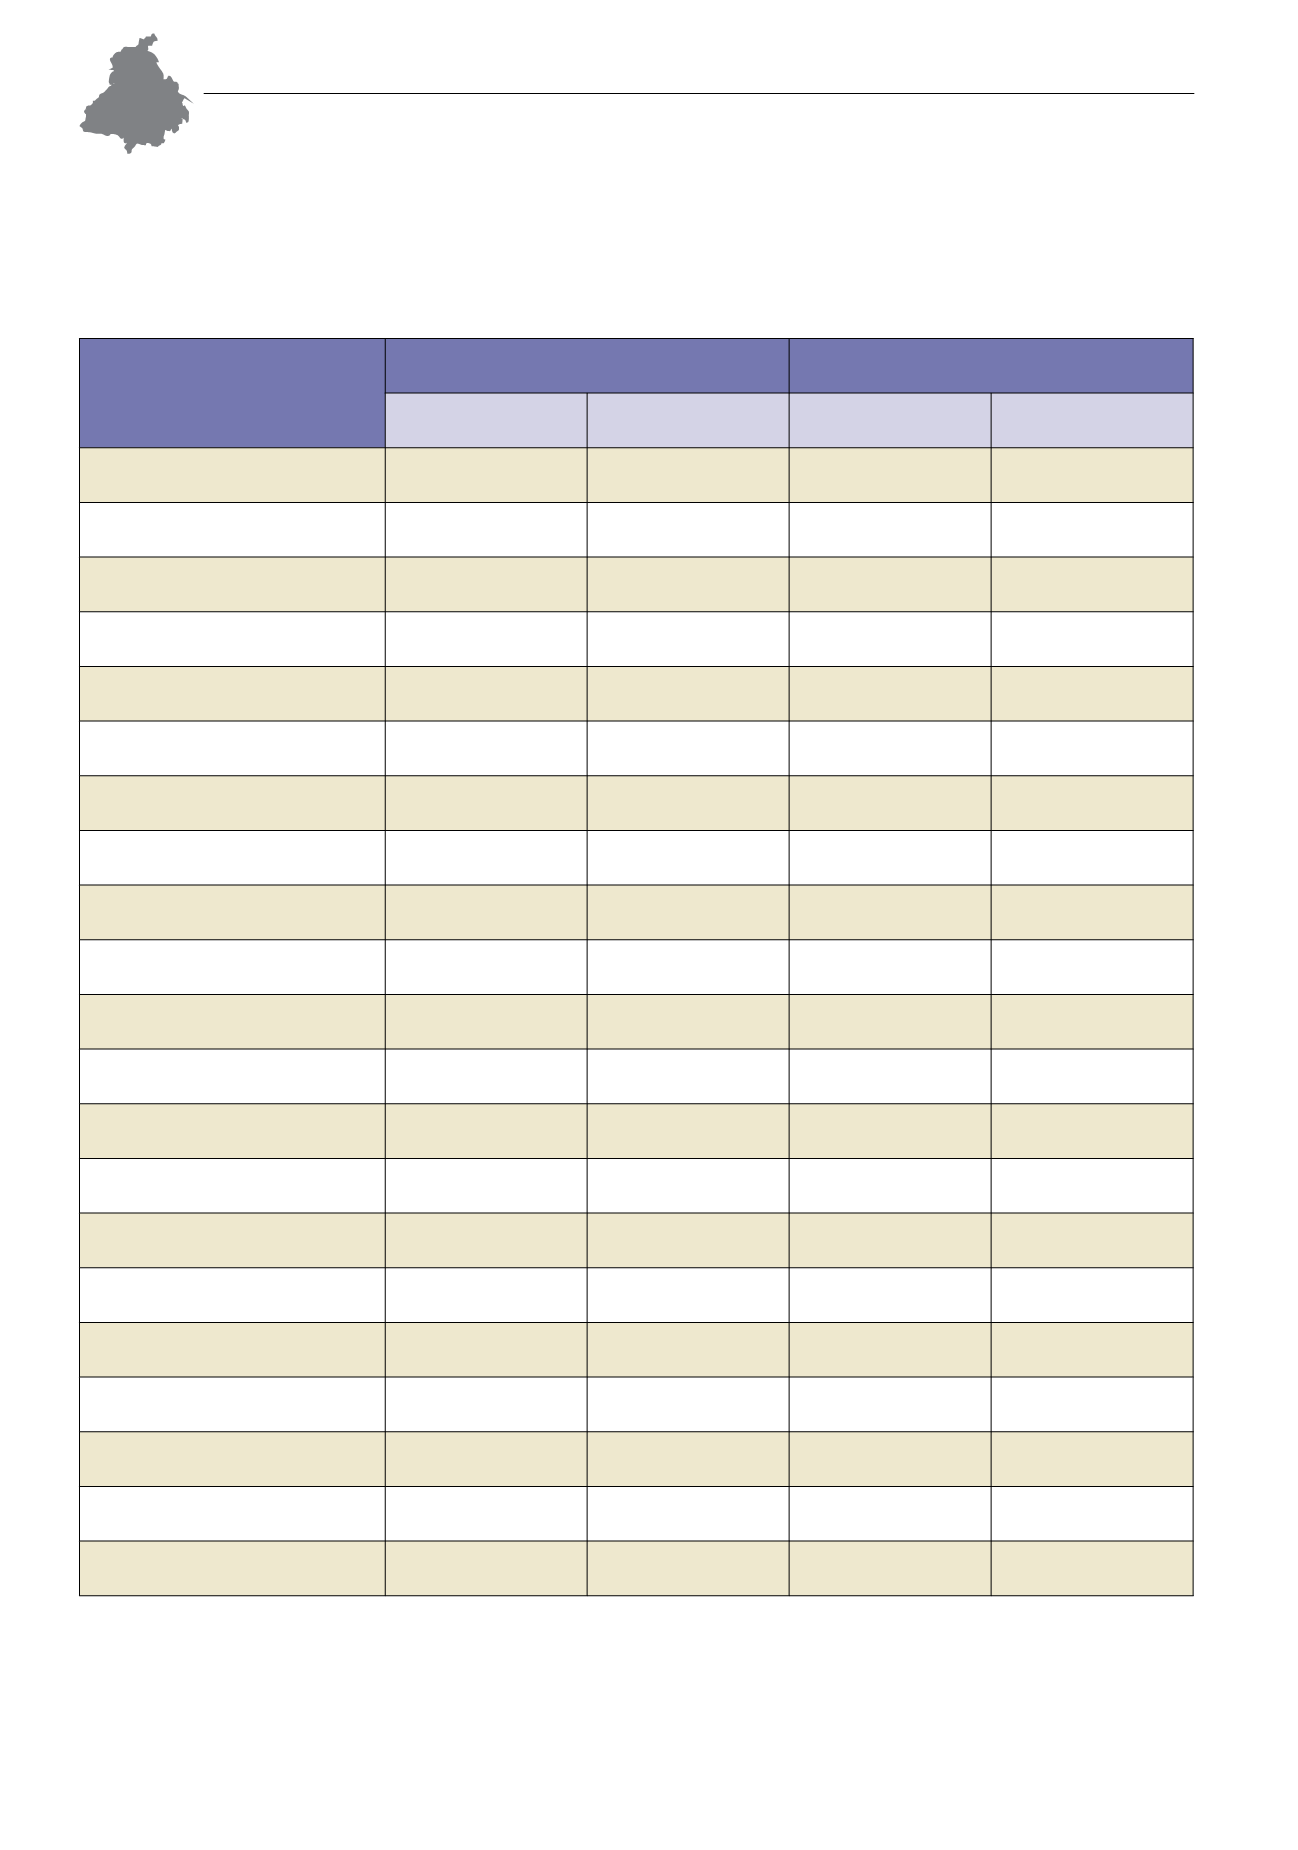
Table I.2.3: District-wise SC and ST Population – 2001 and 2011
Districts
SC Population
(‘000)
ST Population
(‘000)
2001
2011
2001
2011
PUNJAB
7,029
8,860
0
0
Amritsar
891
770
0
0
Barnala
192
0
Bathinda
355
450
0
0
Faridkot
199
240
0
0
Fatehgarh Sahib
165
192
0
0
Firozpur
398
855
0
0
Gurdaspur
521
580
0
0
Hoshiarpur
508
567
0
0
Jalandhar
740
854
0
0
Kapurthala
226
276
0
0
Ludhiana
758
923
0
0
Mansa
209
258
0
0
Moga
285
363
0
0
Patiala
425
465
0
0
Rupnagar (Ropar)
267
180
0
0
Sangrur
551
461
0
0
SAS Nagar (Mohali)
216
0
SBS Nagar (Nawanshahr)
238
260
0
0
Muktsar
294
381
0
0
Tarn Taran
377
0
SC
: Scheduled Caste,
ST
: Scheduled Tribe
Source: Census 2001 and 2011, Office of the Registrar General and Census Commissioner, Govt. of India, New Delhi.