


 12 / 132

Dairying in Punjab
A Statistical Profile
2014
Part I :
General Statistics
7
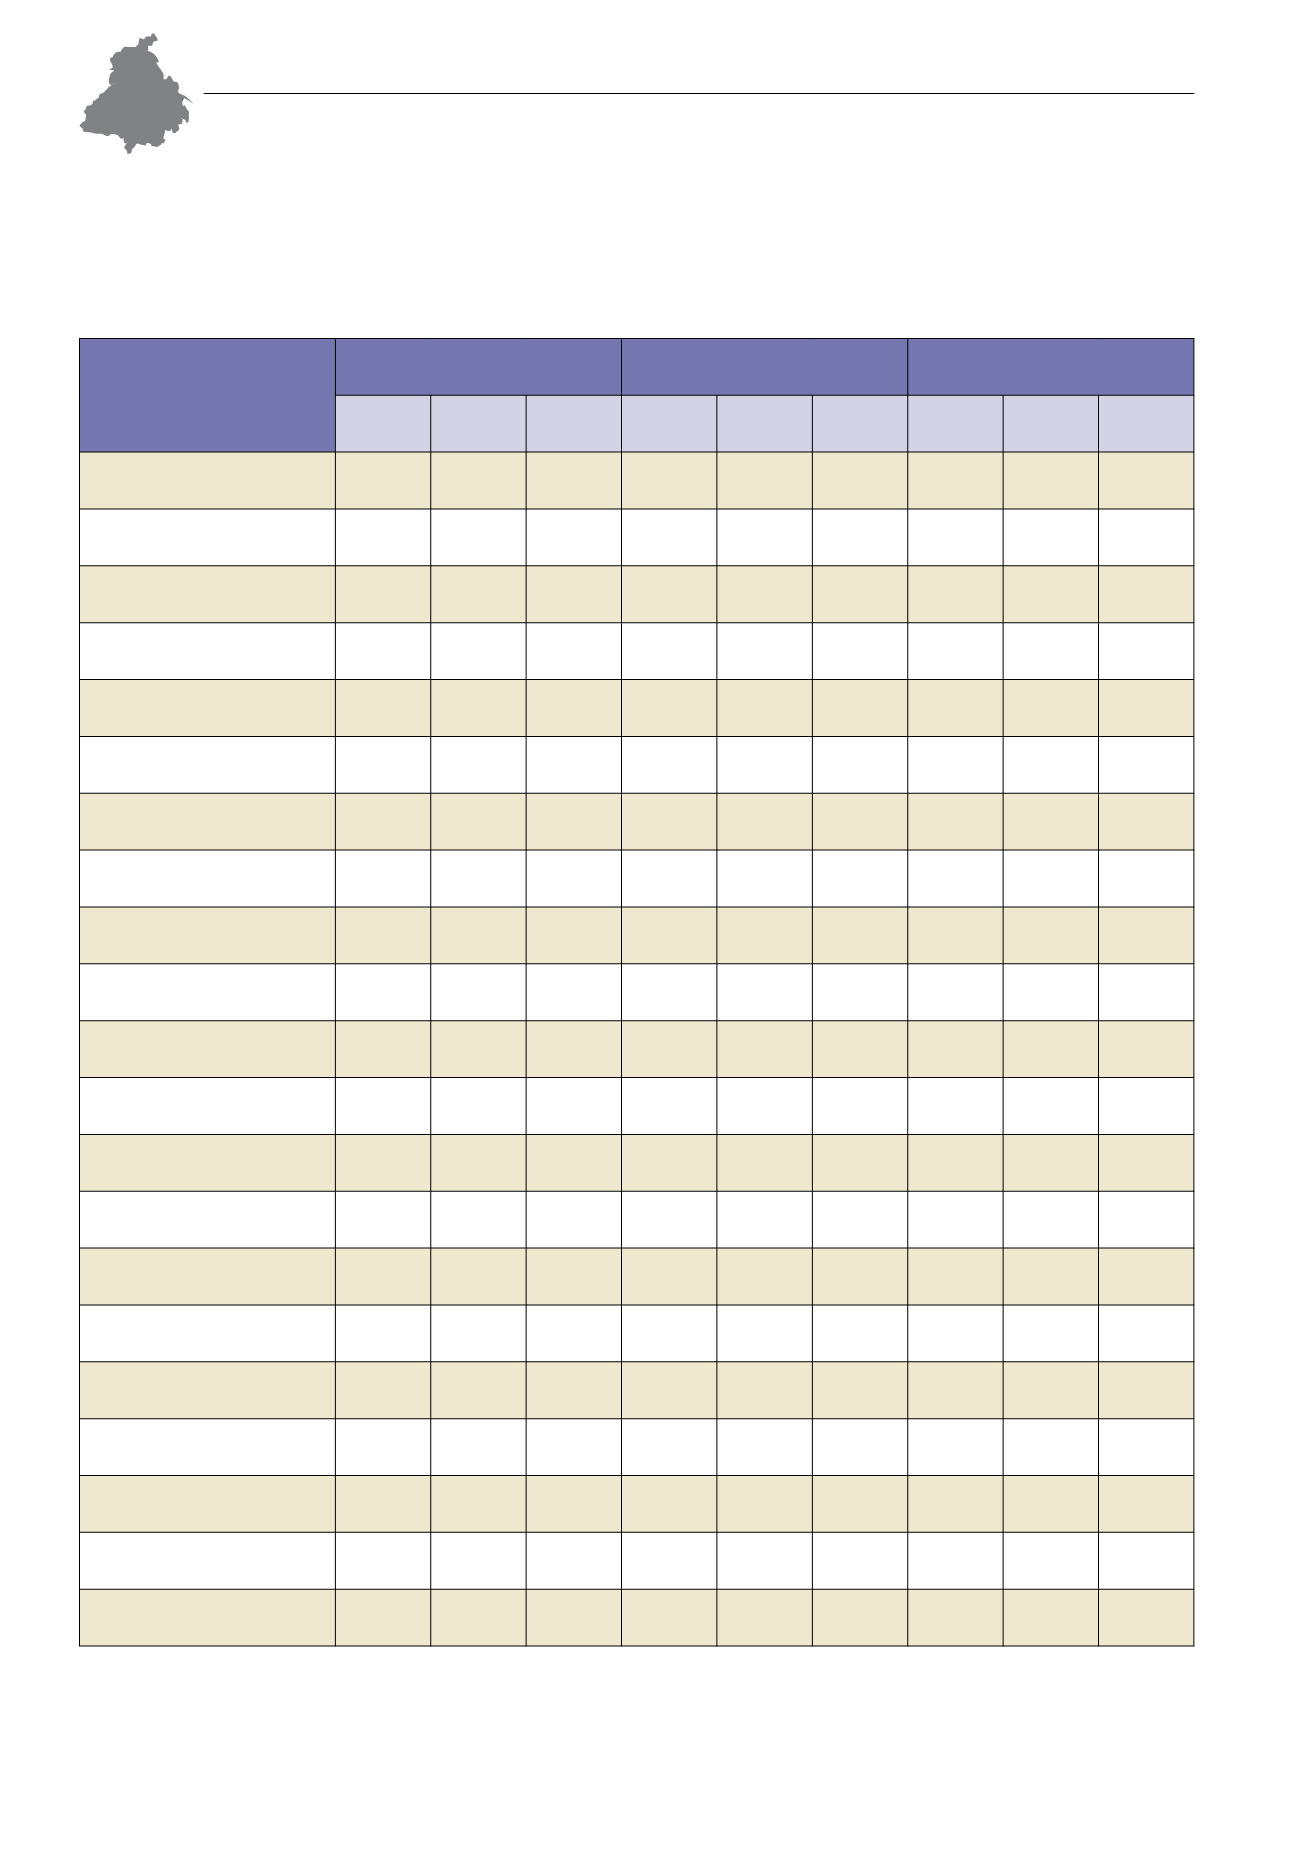
I.2. Social Statistics: Human Population
Table I.2.2: Human Population by Residence and Sex – 2011
Districts
Rural
(‘000)
Urban
(‘000)
Total
(‘000)
Male
Female Total
Male
Female Total
Male
Female Total
PUNJAB
9,093 8,251 17,344 5,546 4,853 10,399 14,639 13,104 27,743
Amritsar
607
549 1,156
711
623 1,335 1,318 1,172 2,491
Barnala
215
190
405
102
88
191
318
278
596
Bathinda
474
415
889
269
231
499
743
645 1,389
Faridkot
211
190
400
116
101
217
327
291
618
Fatehgarh Sahib
220
195
415
101
85
185
321
279
600
Firozpur
776
700 1,477
295
257
553 1,072
957 2,029
Gurdaspur
856
783 1,639
357
302
659 1,213 1,086 2,298
Hoshiarpur
634
617 1,252
175
160
335
809
778 1,587
Jalandhar
529
504 1,032
616
545 1,161 1,145 1,048 2,194
Kapurthala
276
257
533
150
132
282
426
389
815
Ludhiana
753
676 1,429 1,114
955 2,070 1,868 1,631 3,499
Mansa
322
284
606
87
77
164
409
361
770
Moga
406
363
769
120
107
227
526
470
996
Patiala
599
534 1,132
404
360
763 1,003
893 1,896
Rupnagar (Ropar)
264
243
507
93
84
178
357
327
685
Sangrur
605
535 1,139
273
243
516
878
777 1,655
SAS Nagar (Mohali)
241
209
450
288
256
545
529
465
995
SBS Nagar (Nawanshahr)
248
239
487
65
60
125
313
299
612
Muktsar
342
308
650
133
119
252
476
426
902
Tarn Taran
514
464
978
75
67
142
589
530 1,120
Source: Census 2011, Office of the Registrar General and Census Commissioner, Govt. of India, New Delhi.