


 124 / 132

119
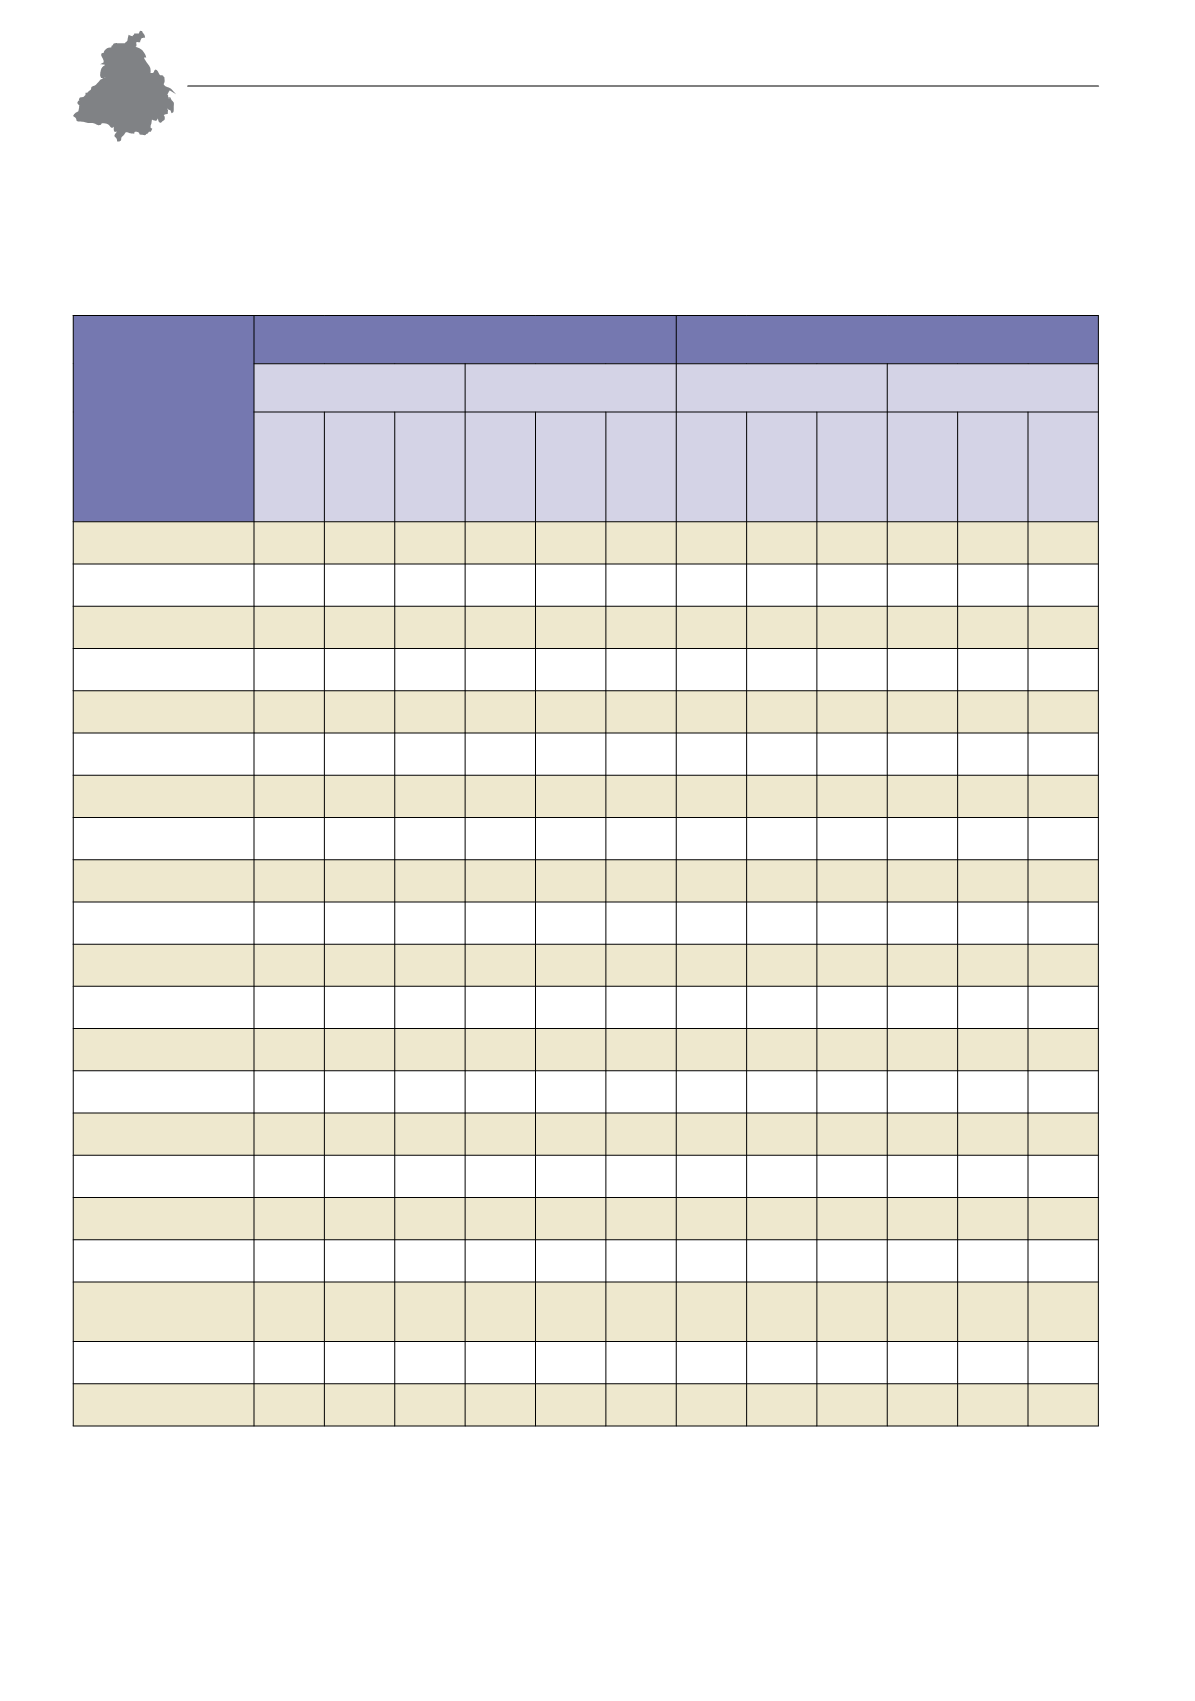
VII.3. Area and Production
TABLE VII.3.3: District-wise Area and Production of Sugarcane and Cotton
Districts
Sugarcane
Cotton
Area
(‘000 ha)
Production
(‘000 MT
)
Area
(‘000 ha)
Production
(‘000bales
)
2004-10*
2011-12
2012-13
2004-10*
2011-12
2012-13
2004-10*
2011-12
2012-13
2004-10*
2011-12
2012-13
PUNJAB
87 80 83 5,247 5,653 5,919 554 515 481 2,305 1,621 1,627
Amritsar
5
3
4 317 203 283
1
2
Barnala
1
70 12 11
9
63 44 32
Bathinda
155 155 151 675 573 581
Faridkot
1
32
24 17 15
96 52 46
Fatehgarh Sahib
3
2
3 182 151 258
Firozpur
2
1
2 100 73 162 135 124 113 531 339 294
Gurdaspur
23 25 25 1,453 1,864 1,818
Hoshiarpur
21 20 19 1,158 1,293 1,321
Jalandhar
11
9 10 618 599 651
Kapurthala
4
3
3 232 221 194
Ludhiana
2
2
2 122 161 135
2
1
1
7
3
2
Mansa
91 93 90 375 338 317
Moga
0.2
10
6
3
2
27
5
9
Patiala
2
3
2 154 264 184
1
1
1
2
3
3
Rupnagar (Ropar)
4
2
3 231 149 227
Sangrur
2
2
2 149 163 161 19 11 11
66 33 44
SAS Nagar (Mohali)
2
1
1
79 65 57
SBS Nagar
(Nawanshahr)
7
6
5 394 407 327
Muktsar
0.3
17
114 98 88 488 228 299
Tarn Taran
1
1
1
43 40 71
2
1
8
3
* Average from 2004-05 to 2009-10, 1 bale = 170 kg.
Source: Ministry of Agriculture, Govt .of Punjab.
Dairying in Punjab
A Statistical Profile
2014
Part VII :
Agriculture