


 126 / 132

121
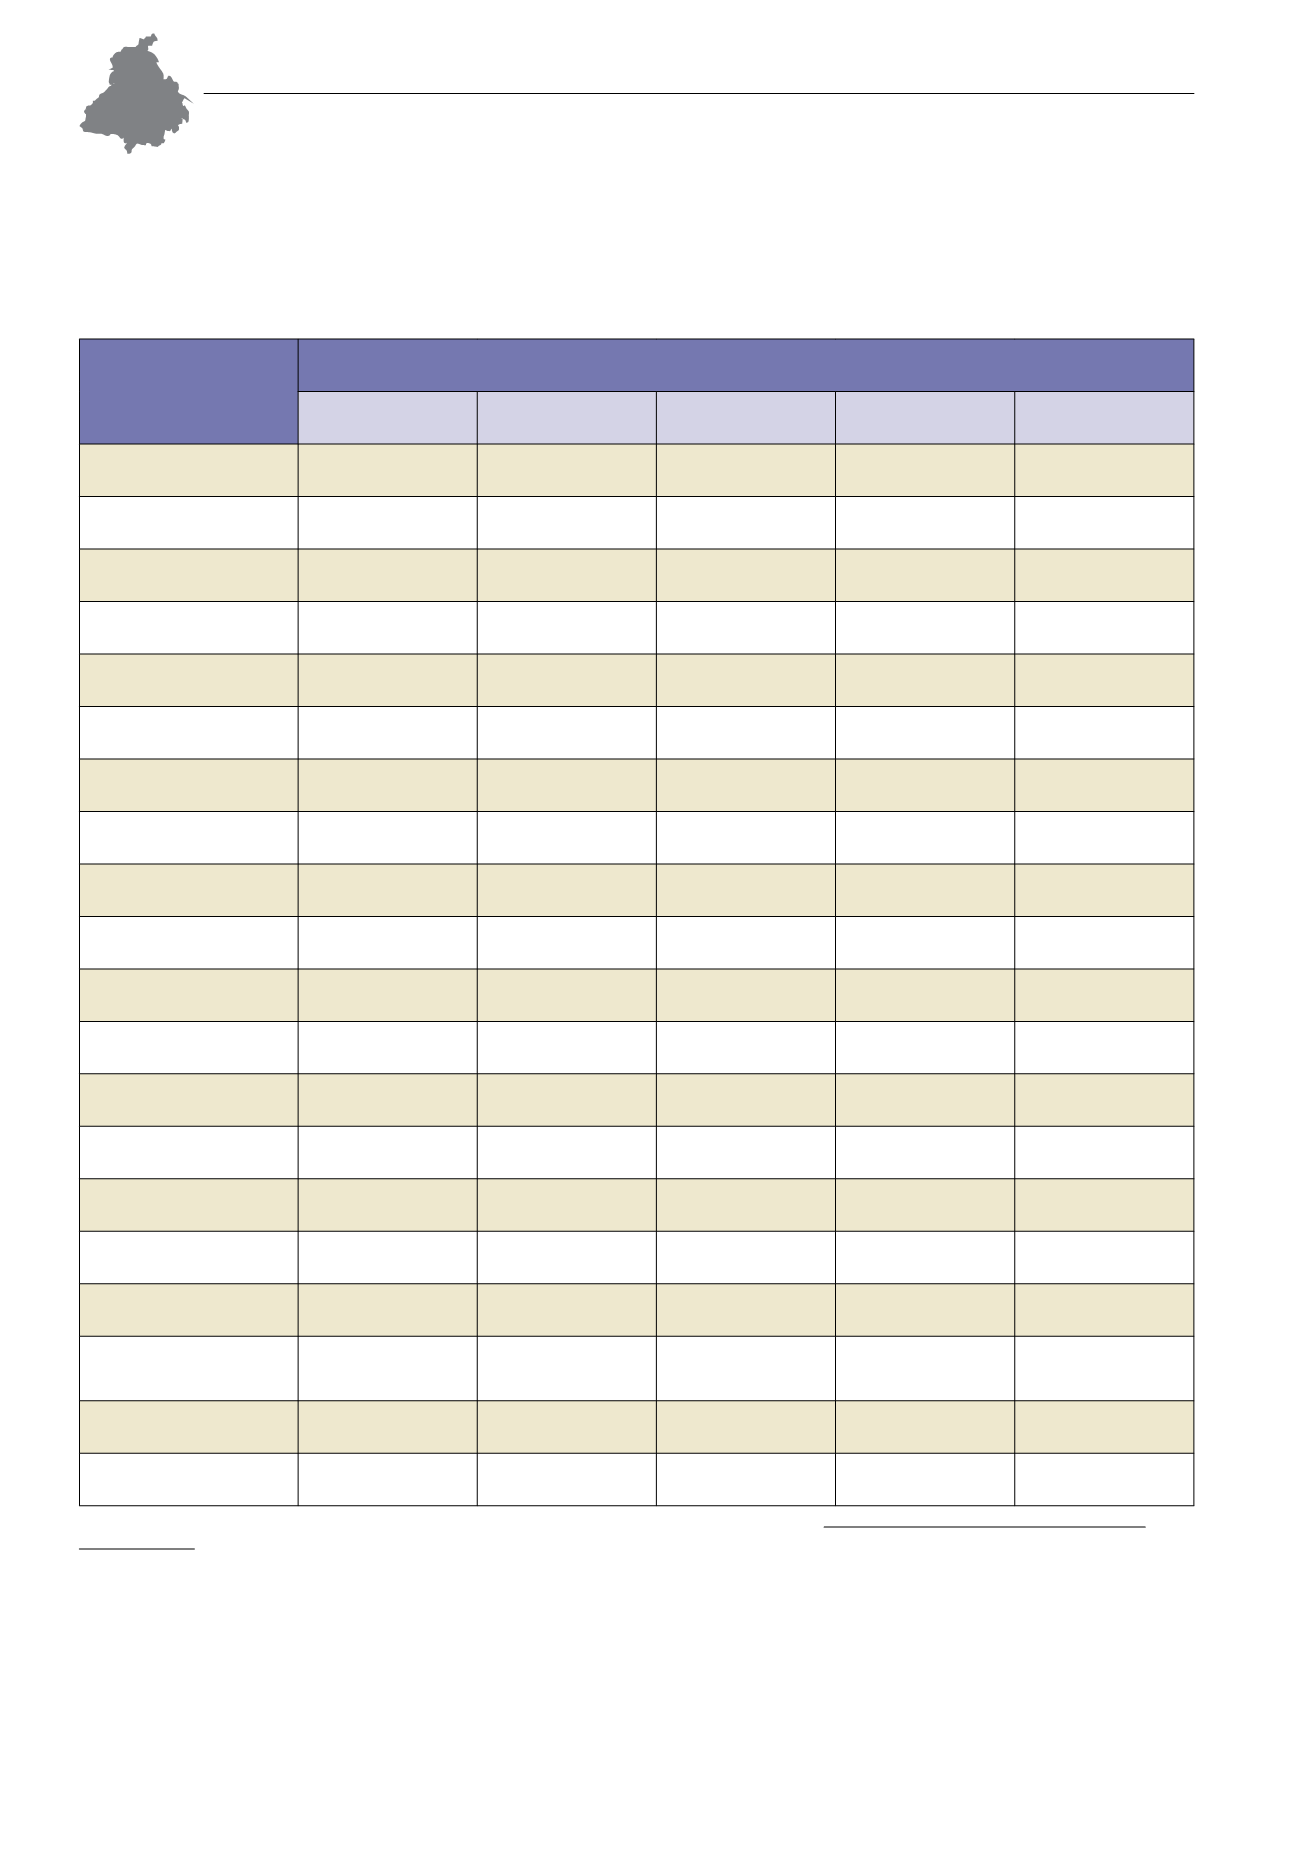
VII.5. Rainfall
TABLE VII.5.1: District- wise Average Annual Rainfall
Districts
Average Rainfall
(mm)
2009
2010
2011
2012
2013
Amritsar
276.4
478.8
546.3
469.1
685.8
Barnala
391.7
303.2
211.6
275.6
Bhatinda
252.2
357.3
493.7
215.9
592.5
Faridkot
323
252.2
411.8
177.8
796.9
Fatehgarh
161.7
304.9
614.5
64.9
695.3
Firozpur
119.3
133
164.2
281.5
65.5
Gurdaspur
599.2
918.1
968.9
1,178.7
1,499.1
Hoshiarpur
602.1
693.3
741.6
442.5
586
Jalandhar
615.4
513.2
571.7
399.3
593.8
Kapurthala
756.5
440.5
697.3
597.9
696.7
Ludhiana
559.8
563.9
700.8
308.3
554.5
Mansa
136.5
186.7
93.9
263.2
Moga
328.8
407.9
605.9
140.1
606.4
Patiala
516.5
798
679.9
371.6
504
Rupnagar (Ropar)
685.6
1,020.9
885.1
782.9
957.8
Sangrur
324.5
515.8
430.4
214.4
325.4
SAS Nagar (Mohali)
1,086
370.4
415.9
646.3
SBS Nagar
(Nawanshahr)
547.5
758.9
1,081
406.6
835.7
Muktsar
176.9
262.4
367.1
74.6
584.3
TaranTaran
Source: Hydromet Division, India Meteorological Department, Ministry of Earth Sciences. Govt. of India,
www.imd.gov.in/selection/hydro/distrainfall/webrain/punjab.
Dairying in Punjab
A Statistical Profile
2014
Part VII :
Agriculture