


 125 / 132

120
VII.4. Land Holding
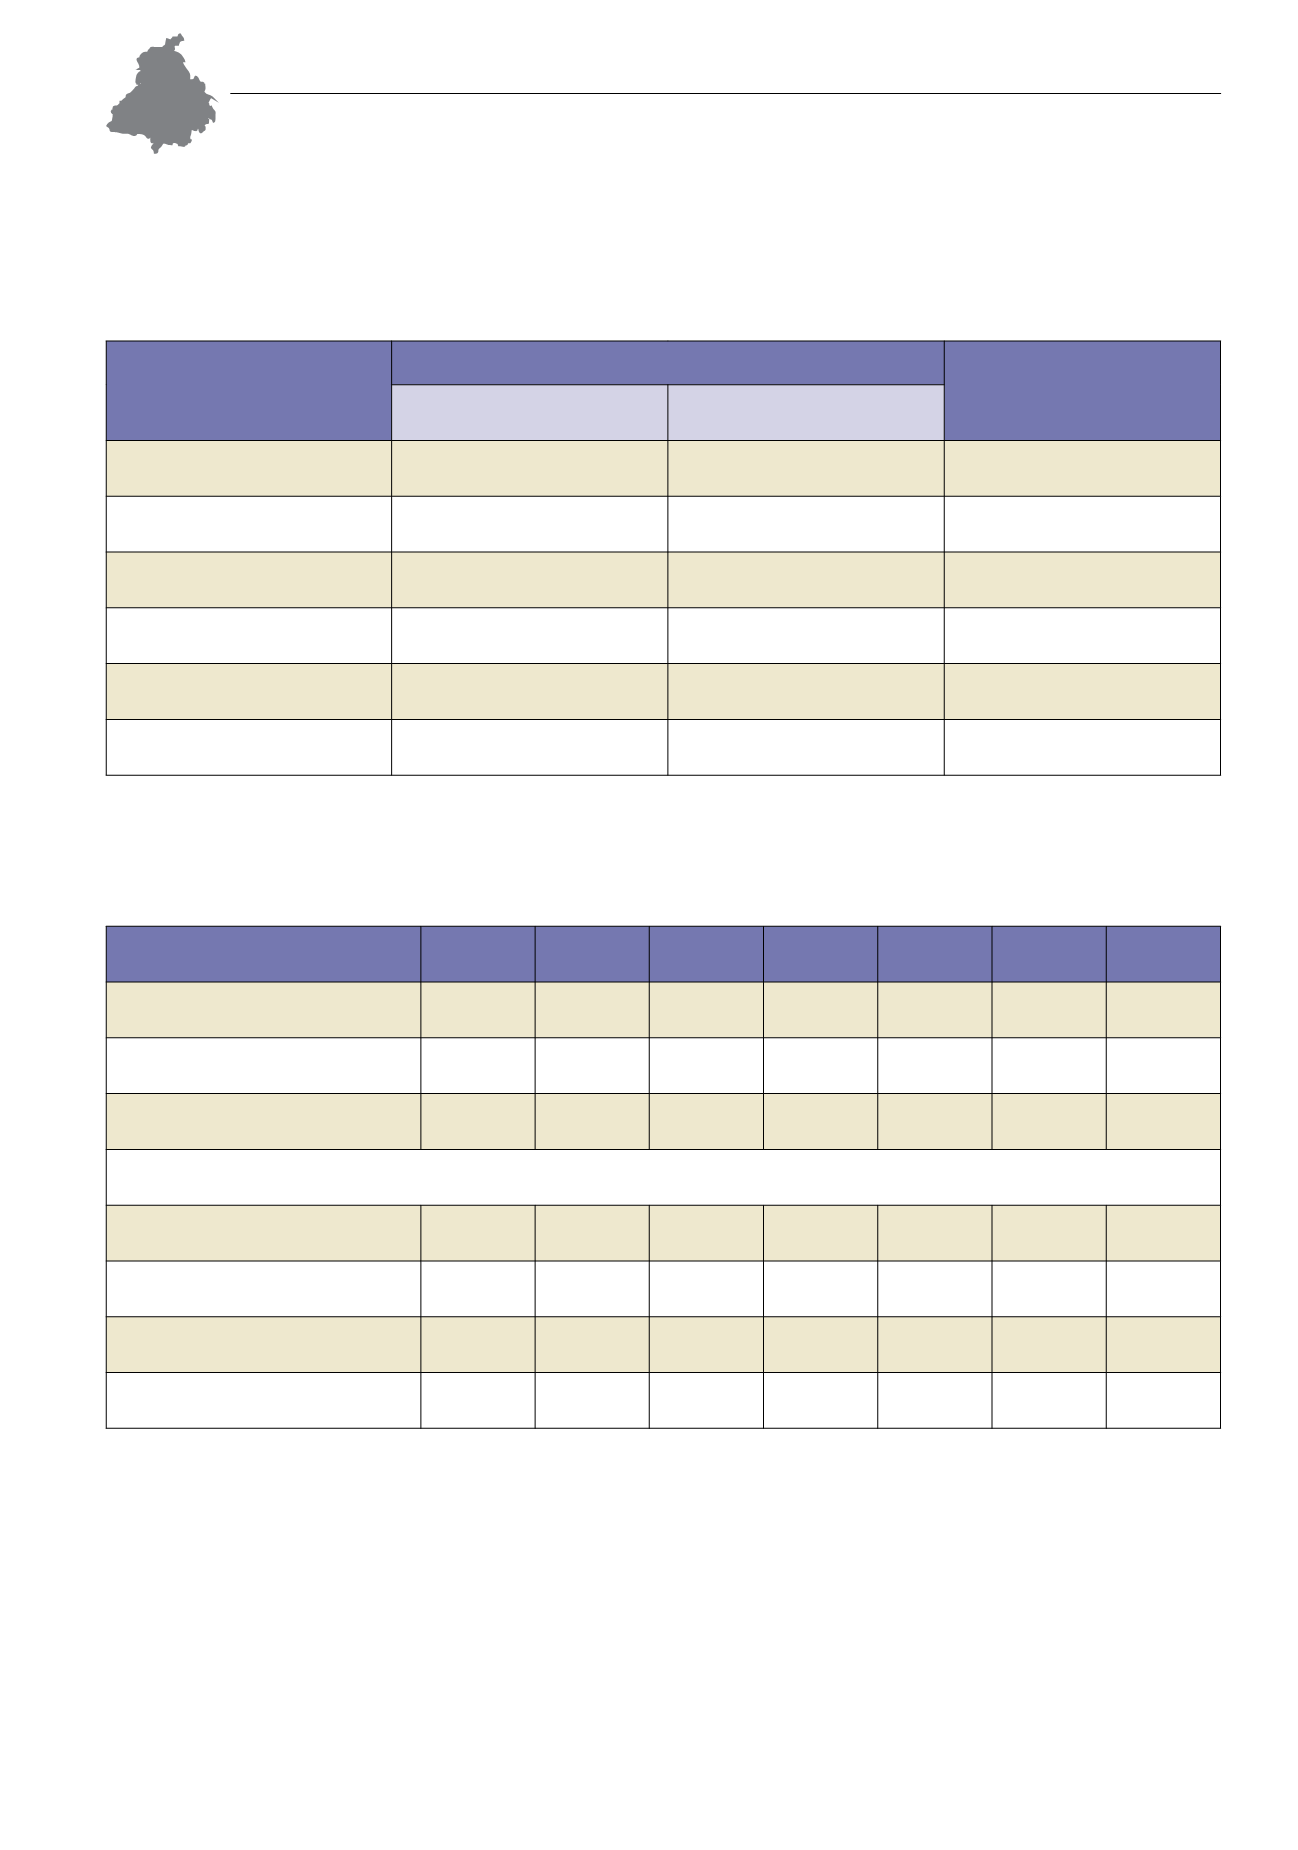
TABLE VII.4.1: Operational Holdings in Punjab
Size of Holding
(ha)
Total Holdings
Average Size of Holding
(ha)
Number
(‘000)
Area
(‘000 ha)
Marginal
164
101
0.62
Small
195
269
1.38
Semi-medium
325
855
2.63
Medium
298
1,713
5.75
Large
70
1,029
14.70
All Classes
1,053
3,967
3.77
Source: Agricultural Census Database, 2010-11, Ministry of Agriculture, Govt of India.
TABLE VII.4.2: Net Irrigated Area under Different Sources of Irrigation
Particulars
1997-98 2001-02 2003-04 2005-06 2007-08 2008-09 2010-11
Gross Sown Area
(‘000 ha)
7,831
7,941
7,907
7,868
7,870
7,912
7,883
Net Sown Area
(‘000 ha)
4,238
4,254
4,240
4,192
4,187
4,169
4,158
Net Irrigated Area
(‘000 ha)
4,004
4,056
4,097
4,019
4,112
4,079
4,070
Sources
(net irrigated area)
(‘000 ha)
Canals
1,296
9,69
1,041
981
1,142
1,112
1,116
Tanks
0
0
0
0
0
0
0
Wells and Tube Wells
2,705
3,084
3,047
2,912
2,967
2,963
2,954
Other Sources
3
3
9
126
4
4
0
Source: Directorate of Economics and Statistics, Ministry of Agriculture, Govt. of India.
Dairying in Punjab
A Statistical Profile
2014
Part VII :
Agriculture