


 10 / 132

Dairying in Punjab
A Statistical Profile
2014
Part I :
General Statistics
5
I.2. Social Statistics: Human Population
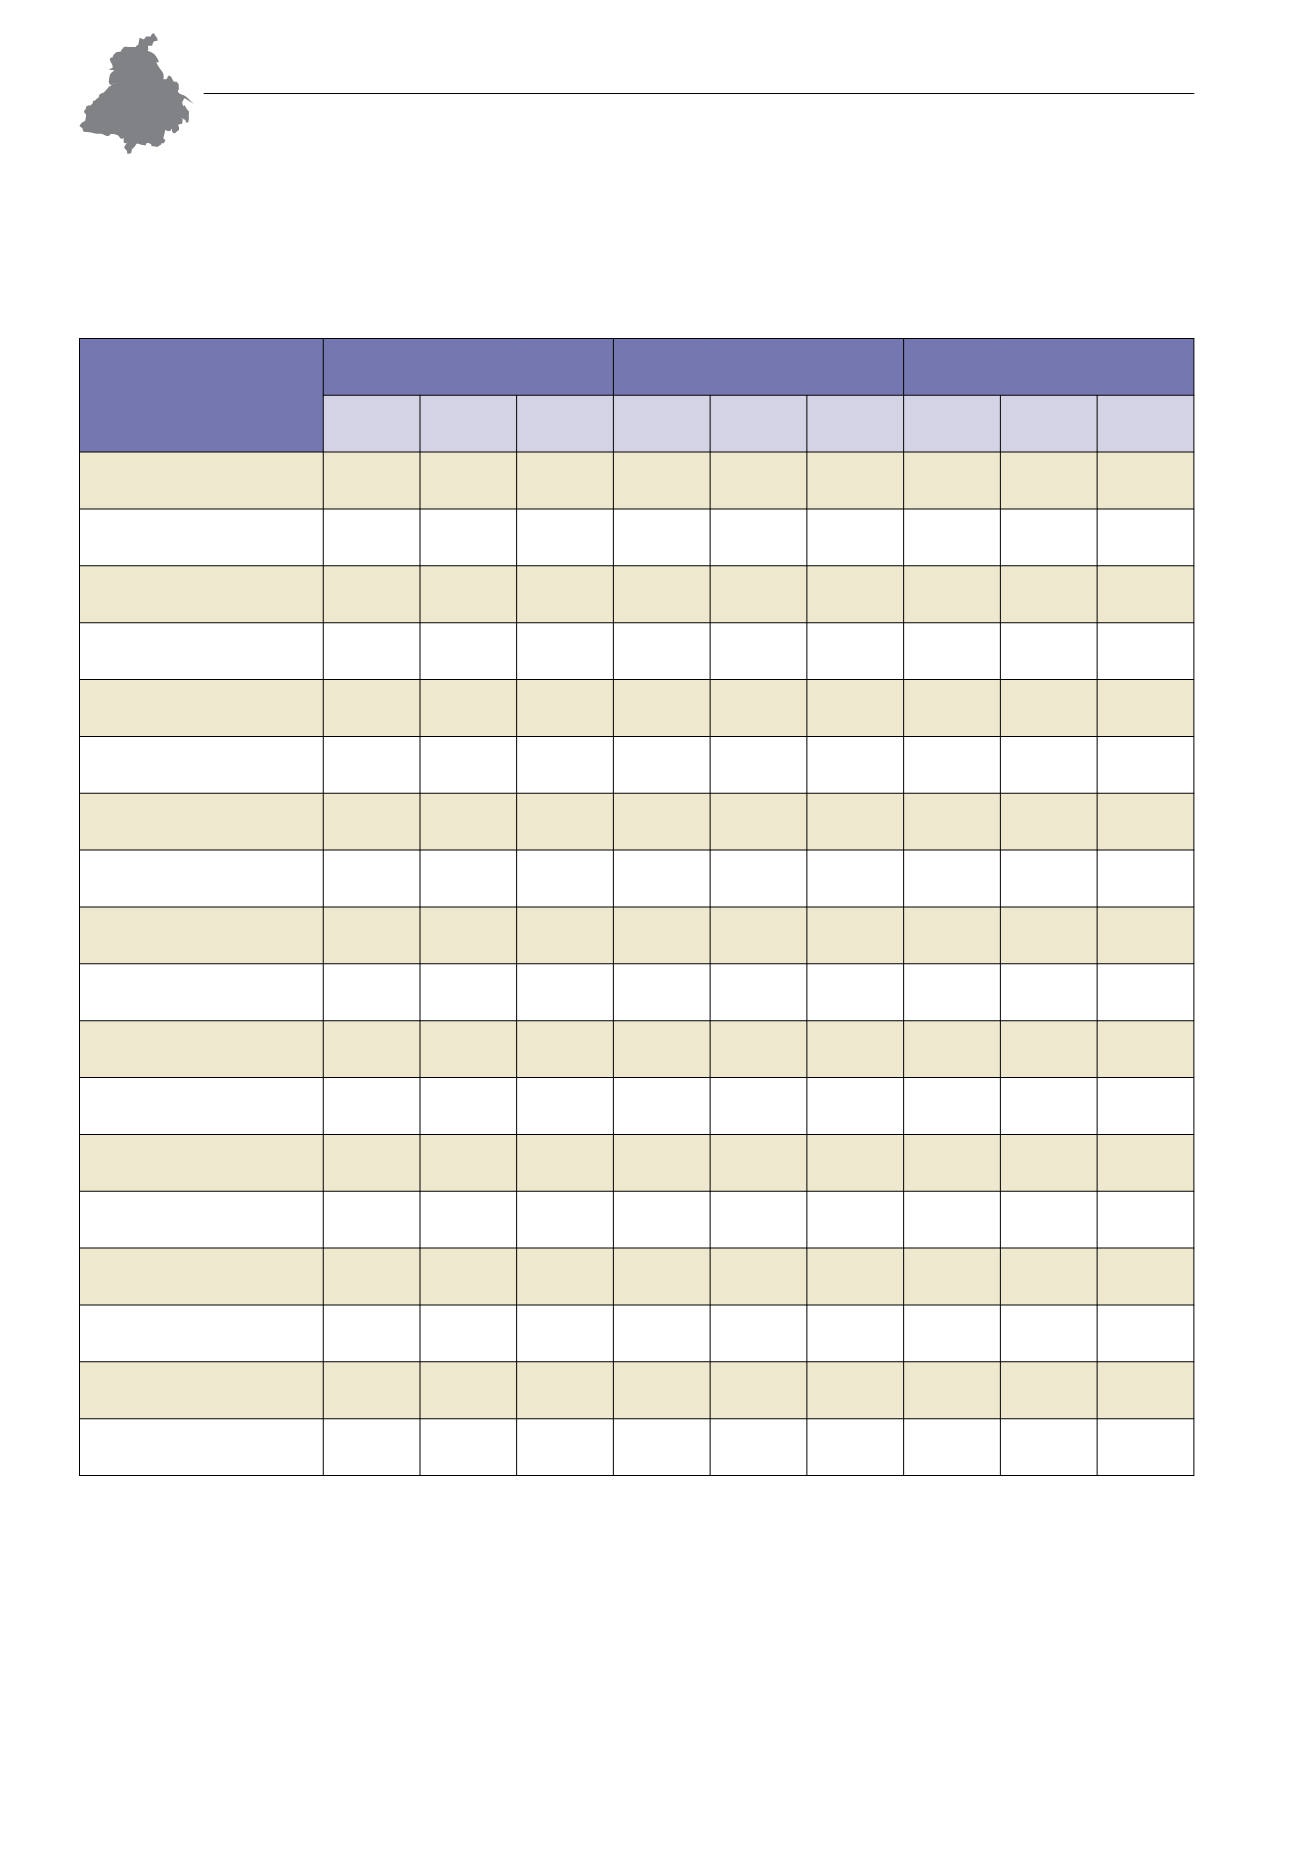
Table I.2.1: Human Population by Residence and Sex – 2001
Districts
Rural
(‘000)
Urban
(‘000)
Total
(‘000)
Male
Female Total
Male
Female Total
Male
Female Total
PUNJAB
8,517 7,580 16,096 4,468 3,794 8,263 12,985 11,374 24,359
Amritsar
994
879 1,873 657
566 1,223 1,651 1,445 3,096
Bathinda
444
387
832 189
163
352
633
550 1,183
Faridkot
189
168
357 104
90
194
293
258
551
Fatehgarh Sahib
208
179
387
82
69
151
290
248
538
Firozpur
684
612 1,295 242
208
451
926
820 1,746
Gurdaspur
827
742 1,569 286
249
535 1,113
991 2,104
Hoshiarpur
611
578 1,189 154
138
292
765
716 1,481
Jalandhar
539
492 1,031 501
431
932 1,040
923 1,963
Kapurthala
266
242
508 134
113
247
400
355
755
Ludhiana
713
627 1,339 950
744 1,694 1,663 1,370 3,033
Mansa
291
256
546
76
67
142
366
322
689
Moga
379
337
716
95
84
179
474
421
895
Patiala
643
558 1,200 345
300
645
987
858 1,845
Rupnagar (Ropar)
403
351
754 193
169
362
597
520 1,116
Sangrur
757
659 1,415 313
272
585 1,069
931 2,000
SBS Nagar (Nawanshahr)
265
242
506
42
39
81
307
281
587
Muktsar
306
273
579 105
93
199
411
366
777
Source: Census 2001, Office of the Registrar General and Census Commissioner, Govt. of India, New Delhi.
Barnala, SAS Nagar (Mohali), Fazilka, Pathankot & Tarn Taran were not formed in 2001.