


 7 / 132

2
Dairying in Punjab
A Statistical Profile
2014
Part I :
General Statistics
I.1. Punjab at a Glance
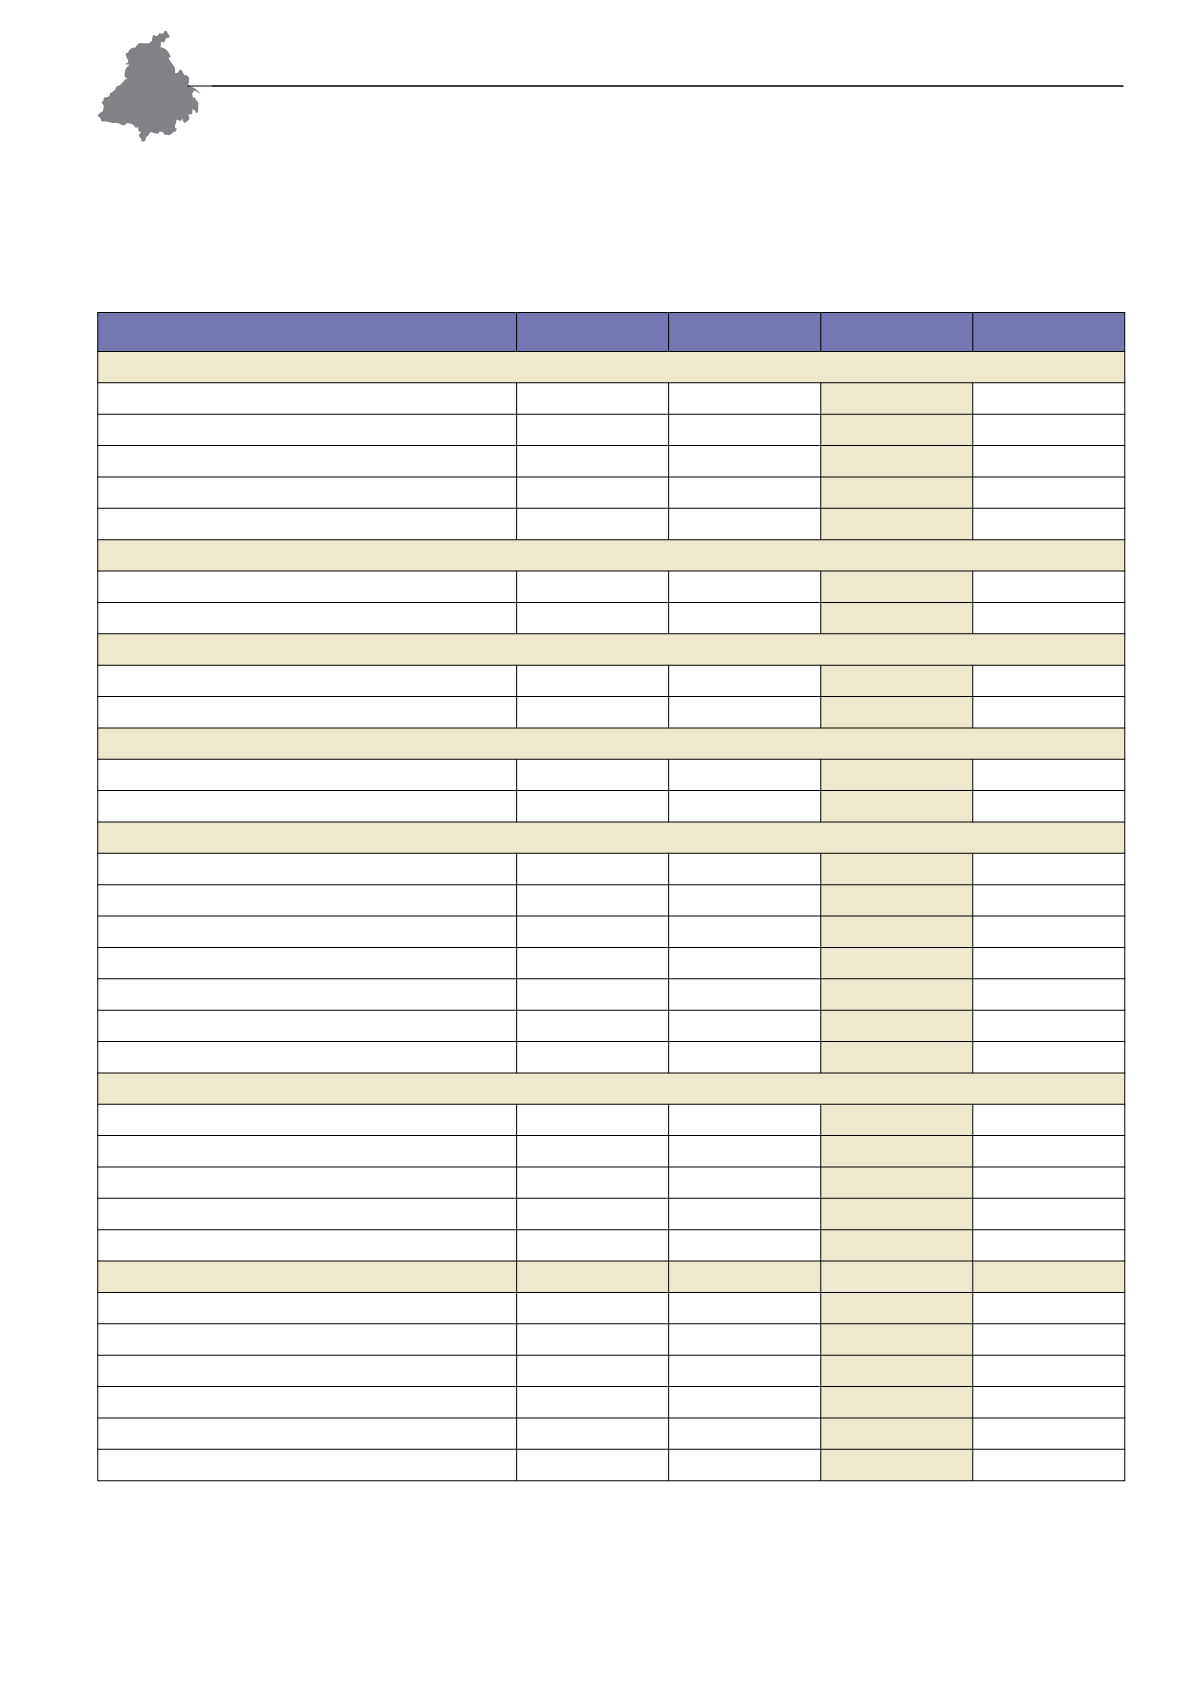
TABLE I.1.1: General Statistics: Punjab State vs. India
Particulars
Unit
Year
Punjab
India
State Geography & Rural Infrastructure
Geographical Area
‘000 sq. km 2012
50.4
3,287.3
Districts
nos
2011
20
640
Sub-Districts
‘’
‘’
77
5,924
Inhabited Villages
‘000
‘’
12.6
640.9
Households
million
‘’
5.5
249.4
Rural Households
2001
‘000
2001
2,796
1,37,414
2011
‘’
2011
3,358
1,68,565
Rural Households with Electricity
2001
%
2001
89
44
2011
‘’
2011
94
55
Rural Households with Tap water supply
2001
%
2001
16
24
2011
‘’
2011
34
31
Human Population
Population
million
2011
27.7
1,210.1
Urban (As % of total)
%
‘’
37.4
31.2
Rural (As % of total)
‘’
‘’
62.5
68.8
Density of Population
per sq. km
‘’
550
382
Scheduled Castes (As % of total)
%
‘’
31.9
16.6
Scheduled Tribes (As % of total)
‘’
‘’
0
8.6
Sex Ratio
Ratio
‘’
893
940
Literacy Rate (excluding population of 0 to 6 age group)
Male
%
2011
81.5
82.1
Female
‘’
‘’
71.3
65.5
Urban
‘’
‘’
83.7
84.9
Rural
‘’
‘’
72.5
68.9
Per Capita Income (at current prices)
`
2012-13
88,783
69,585
Livestock Population
million
2012
8.1
512.0
Bovine
‘’
‘’
7.6
299.9
Indigenous Cattle
‘’
‘’
0.4
151.2
Crossbred Cattle
‘’
‘’
2.1
39.7
Buffaloes
‘’
‘’
5.2
108.7
Small Ruminants
‘’
‘’
0.5
200.2
Poultry Population
‘’
‘’
16.8
729.2