


 8 / 132

Dairying in Punjab
A Statistical Profile
2014
Part I :
General Statistics
3
I.1. Punjab at a Glance
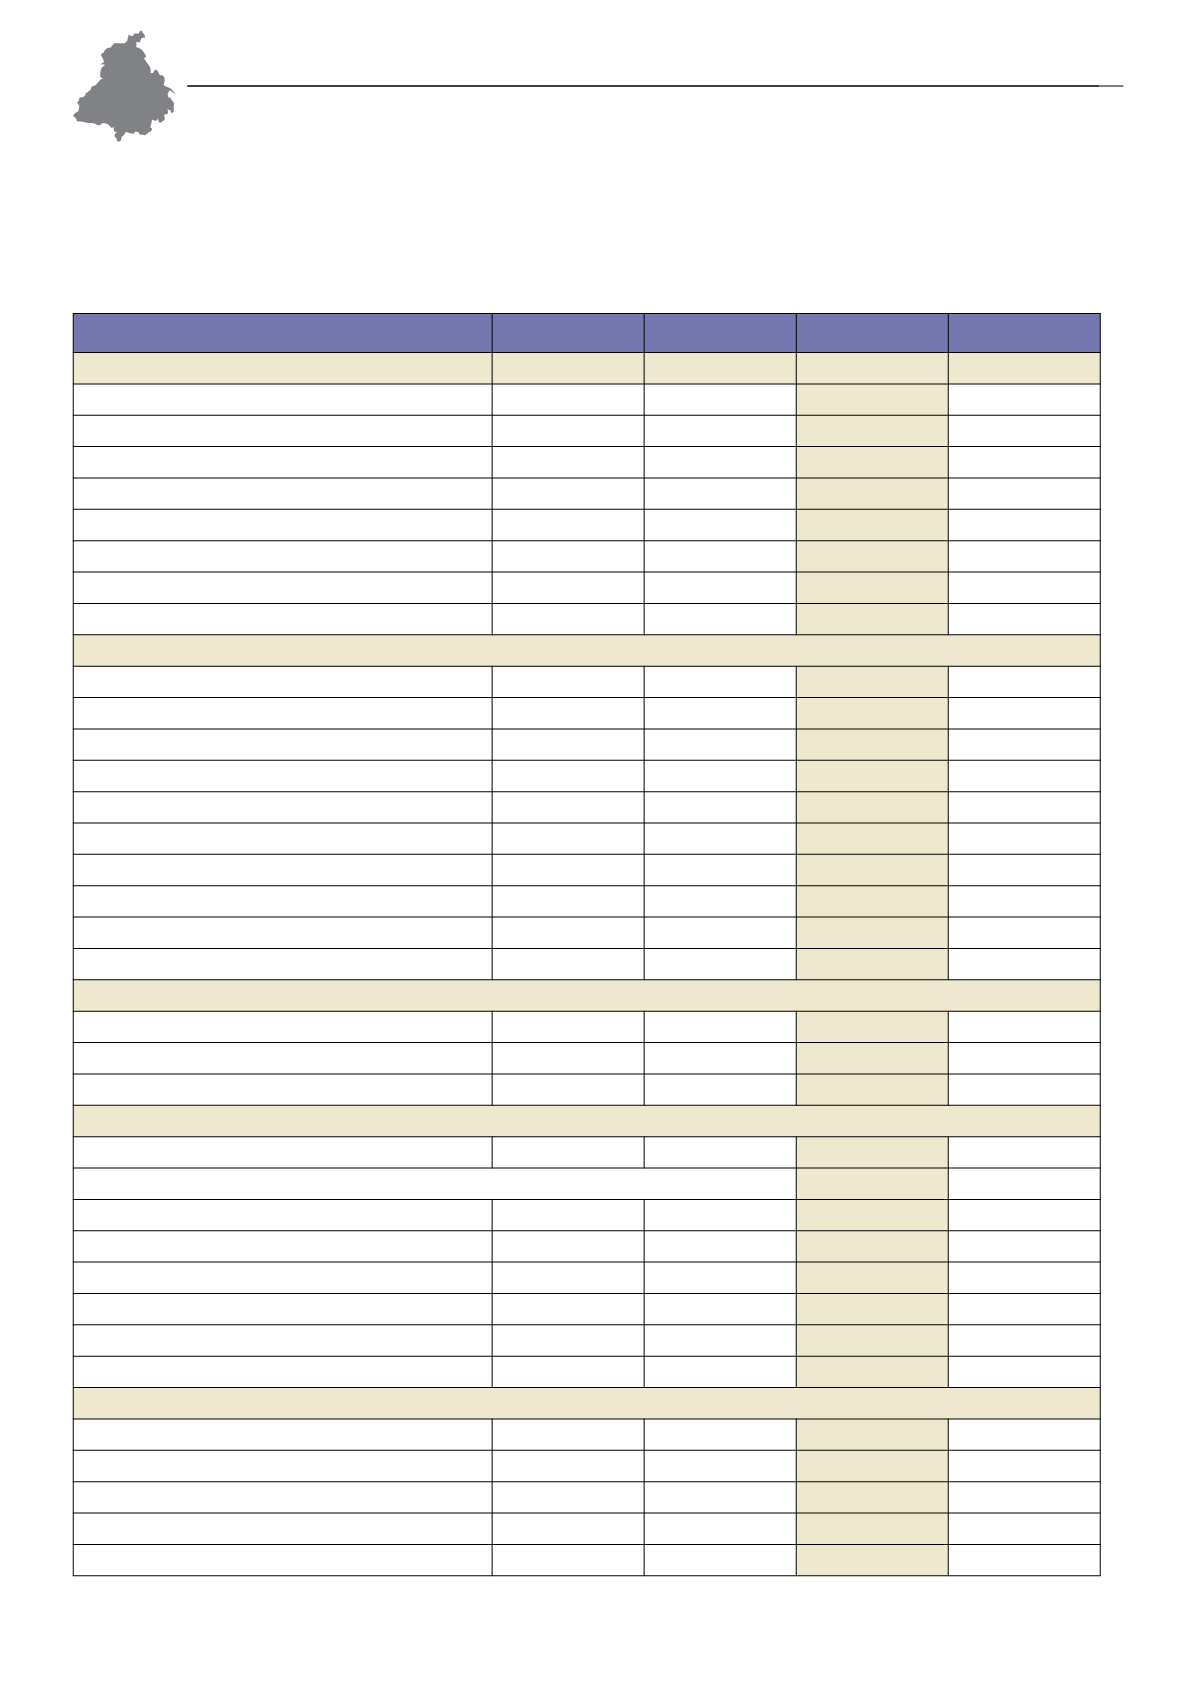
TABLE I.1.1: General Statistics: Punjab State vs. India
Particulars
Unit
Year
Punjab
India
Livestock Population
million
2007
7.4
529.7
Bovine
‘’
‘’
6.8
304.8
Indigenous Cattle
‘’
‘’
0.5
166.0
Crossbred Cattle
‘’
‘’
1.3
33.1
Buffaloes
‘’
‘’
5.1
105.3
Small Ruminants
‘’
‘’
0.5
212.1
Poultry Population
‘’
‘’
10.7
648.9
Number of Cattle Breeds
nos
‘’
2
30
Number of Buffalo Breeds
“
‘’
2
12
Livestock Production
Milk Production - Total
‘000 MT
2012-13
9,724
1,32,431
Crossbred Cattle
‘’
‘’
2,782
32,384
Indigenous Cattle
‘’
‘’
304
27,421
Buffaloes
‘’
‘’
6,575
67,675
Goats
‘’
‘’
63
4,950
Per Capita Milk Availability (estimated)
gms/day
‘’
942
295
Egg Production
million
‘’
3,792
69,730
Estimated Meat Production
‘000 MT
‘’
212
5,948
Marine & Inland Fish Production
‘’
‘’
99
9,062
Wool Production
‘000 Kg
‘’
557
46,055
Veterinary Infrastructure
Veterinary Institutes
nos
2012-13
2,852
57,724
Semen Stations
‘’
2011-12
3
54
AI Centers (Govt)
‘’
2012-13
3,824
77,765
Veterinary Services
AI Done (Govt)
‘000
2012-13
4,213
41,165
Vaccination Done
H.S. Vaccination
‘’
2012-13
6,257
B.Q. Vaccination
‘’
2010-11
63
FMD Vaccination
‘’
2012-13
13,446
Total Bovine
‘’
‘’
19,703
Treatment
‘’
‘’
5,369
Castration
‘’
‘’
16
Agricultural Resources
Forest Cover
%
2010-11
5.8
21.3
Pasture and Grazing Land
‘000 ha
‘’
4
10,301
As %of total reporting area
%
‘’
0.1
3.4
Area Under Fodder Crops
‘000 ha
‘’
540
7,769
As % of Gross Cropped Area
%
‘’
98
45